 LayMesh
LayMesh feature gallery#
Each example shows a short explanation, key code, its actual rendered image immediately below, the full source, reproduction commands, and observed results. Images and source files live in this repository.
Browse by capability#
Images and illustrations · 10 examples#
Input formats, reuse, independent crops, and fitting images into frames. All sample assets are generated in this repository.
PNG bitmap · JPEG bitmap · SVG vector asset · 8-bit grayscale TIFF · 8-bit RGB TIFF · Reuse one asset · Independent crops · Contain · Cover · Stretch
Positioning and layers · 6 examples#
Build relationships with placement anchors; rotation, opacity, and add order then determine the final drawing.
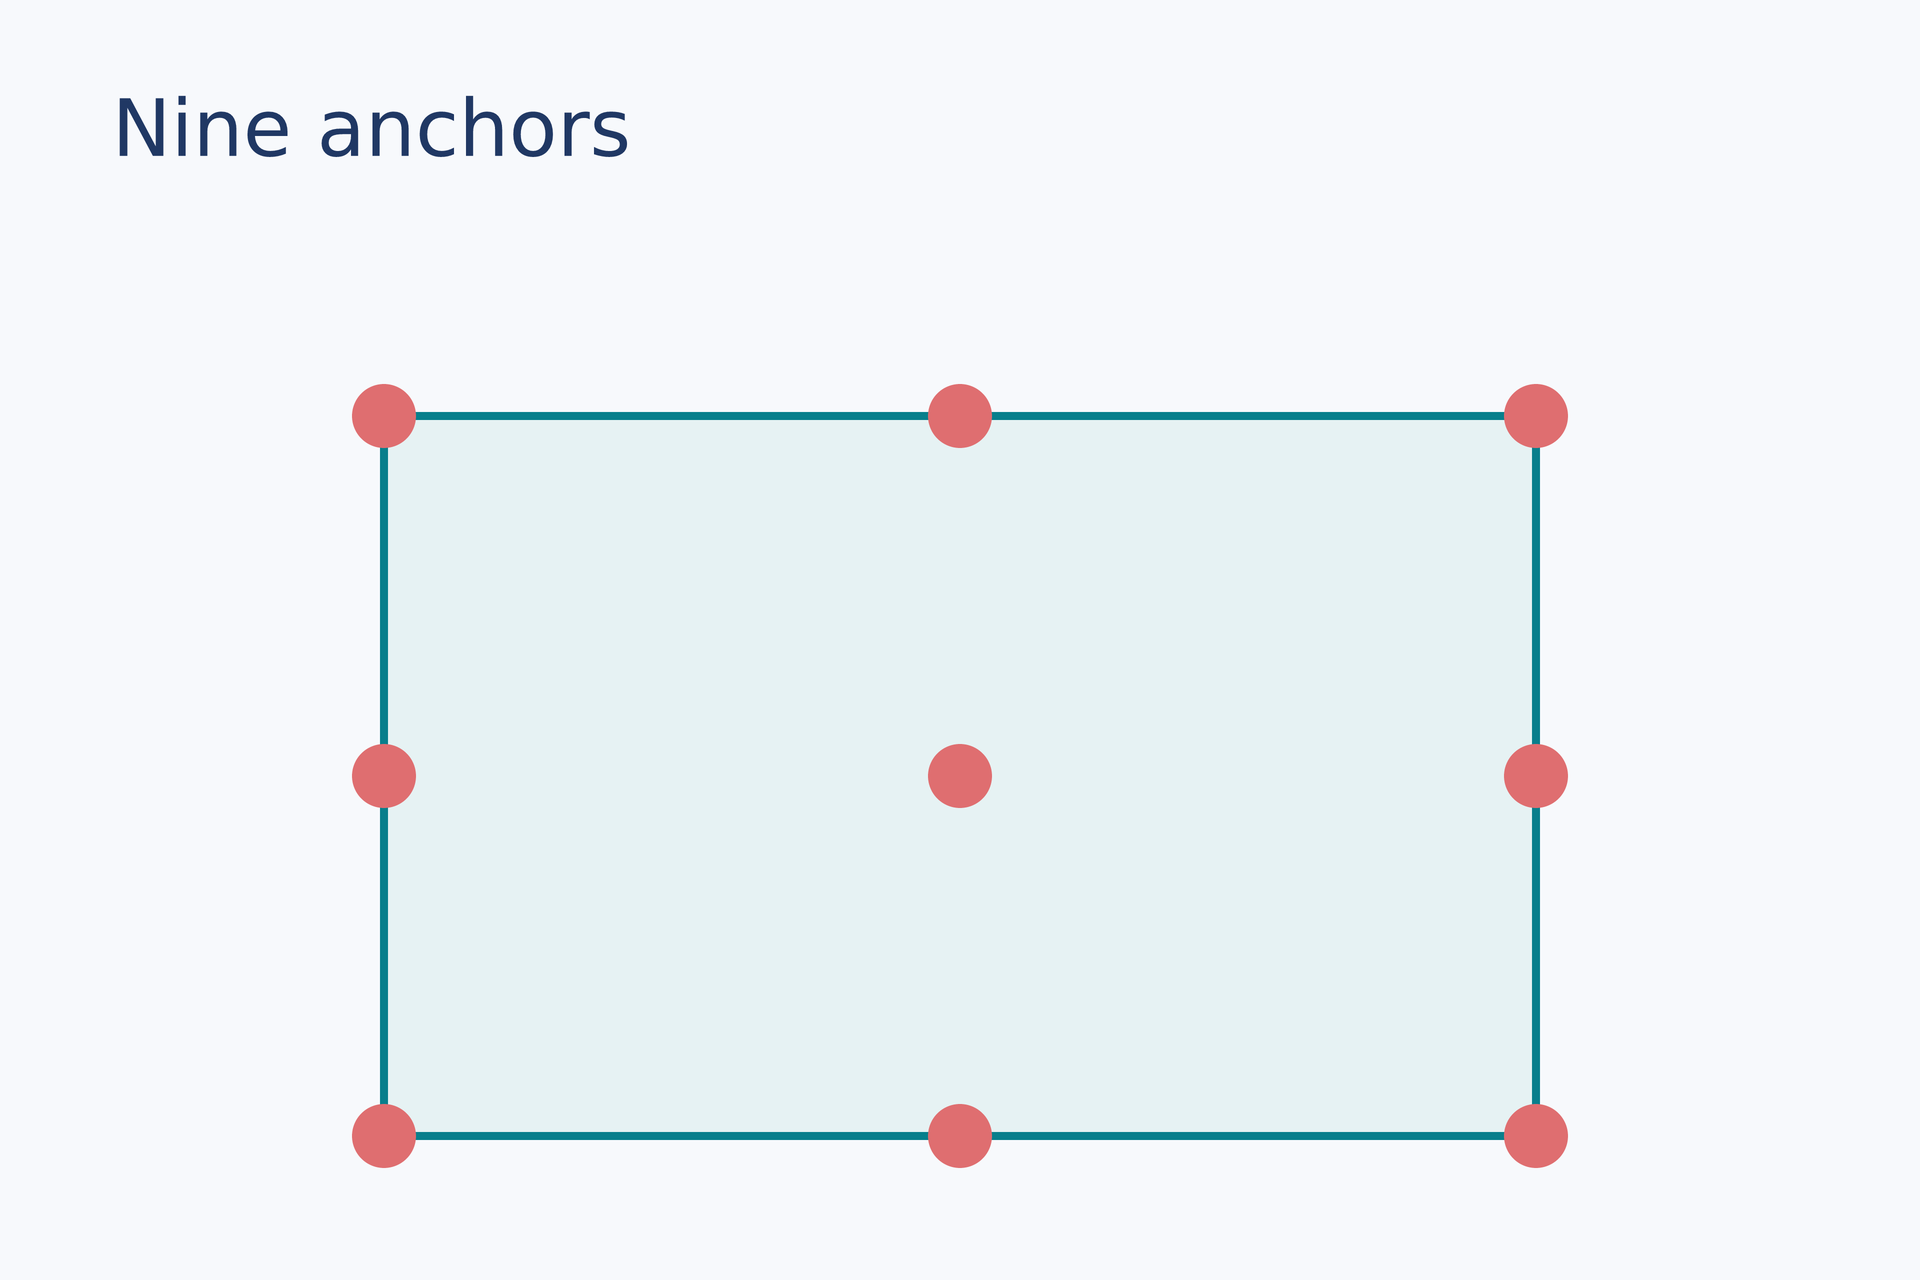
Nine-point anchors · Relative placement chain · Size-dependent placement · Rotation · Opacity · Drawing order
Groups and components · 4 examples#
Organize objects in local coordinates and reuse layouts through groups and local modules.
Local group coordinates · Nested groups and scaling · Place one group twice · Local module component
Shapes and drawing · 17 examples#
Basic shapes, paths, fills, dashes, compound outlines, and visible-outline fusion.
Rounded rectangle · Ellipse · Line and arrow · Polygon and polyline · Arc and sector · Star and ring · Path commands · Even-odd hole · Linear gradient · Radial gradient · Custom dashes · Reusable outlines · Visible-outline fusion · Angled line on a straight edge · Angled line on a curved edge · Line joined to a hollow edge · Line joined to a hollow corner
Text and formulas · 5 examples#
Fonts, wrapping, colored spans, inline formulas, and standalone formulas.
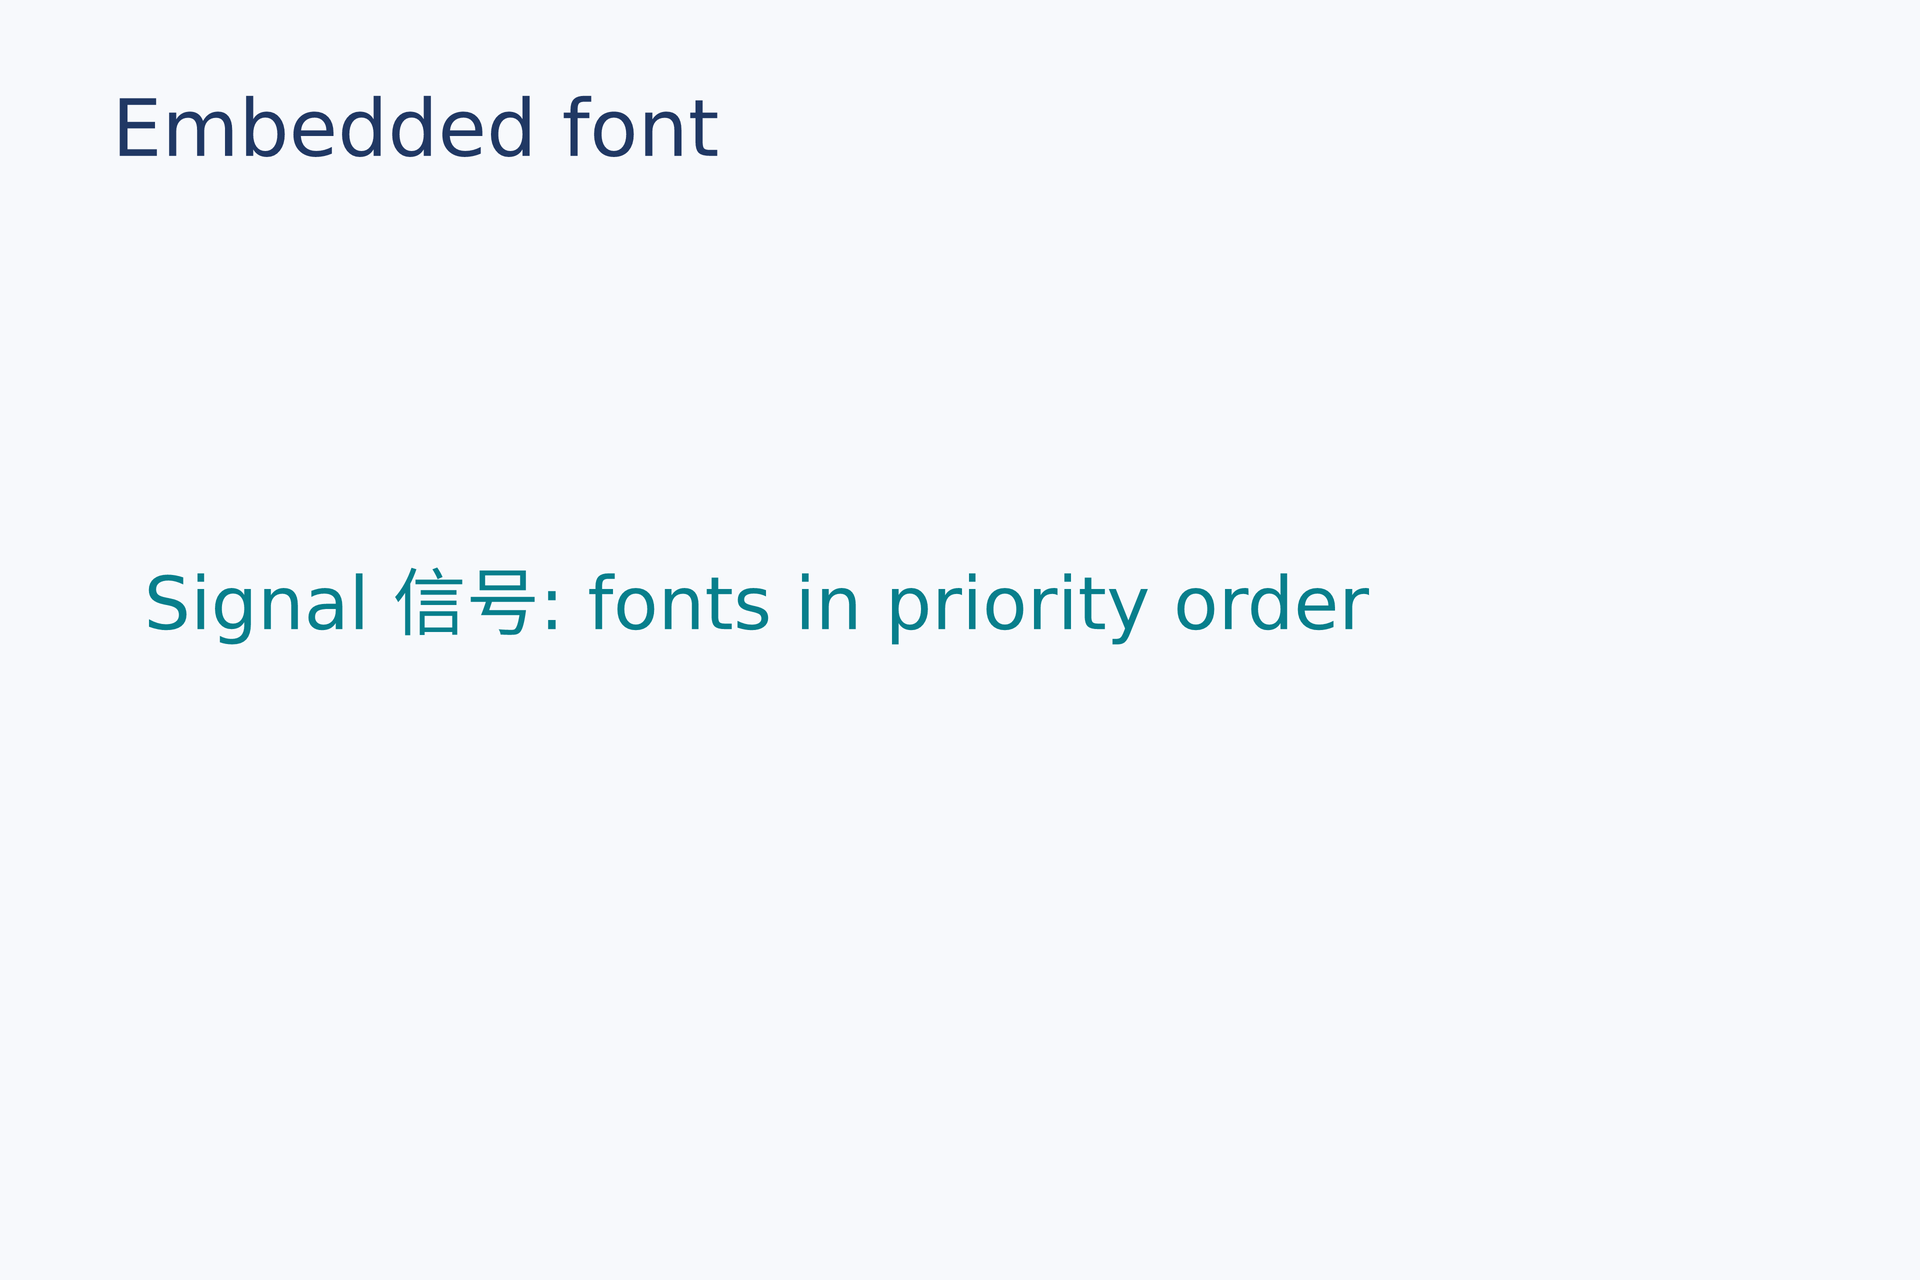
Font names and fallback · Width, wrapping, and alignment · Colored text spans · Inline formula · Display formula
Scripting and calculations · 2 examples#
Variables, units, functions, and control flow within the restricted .lay language.
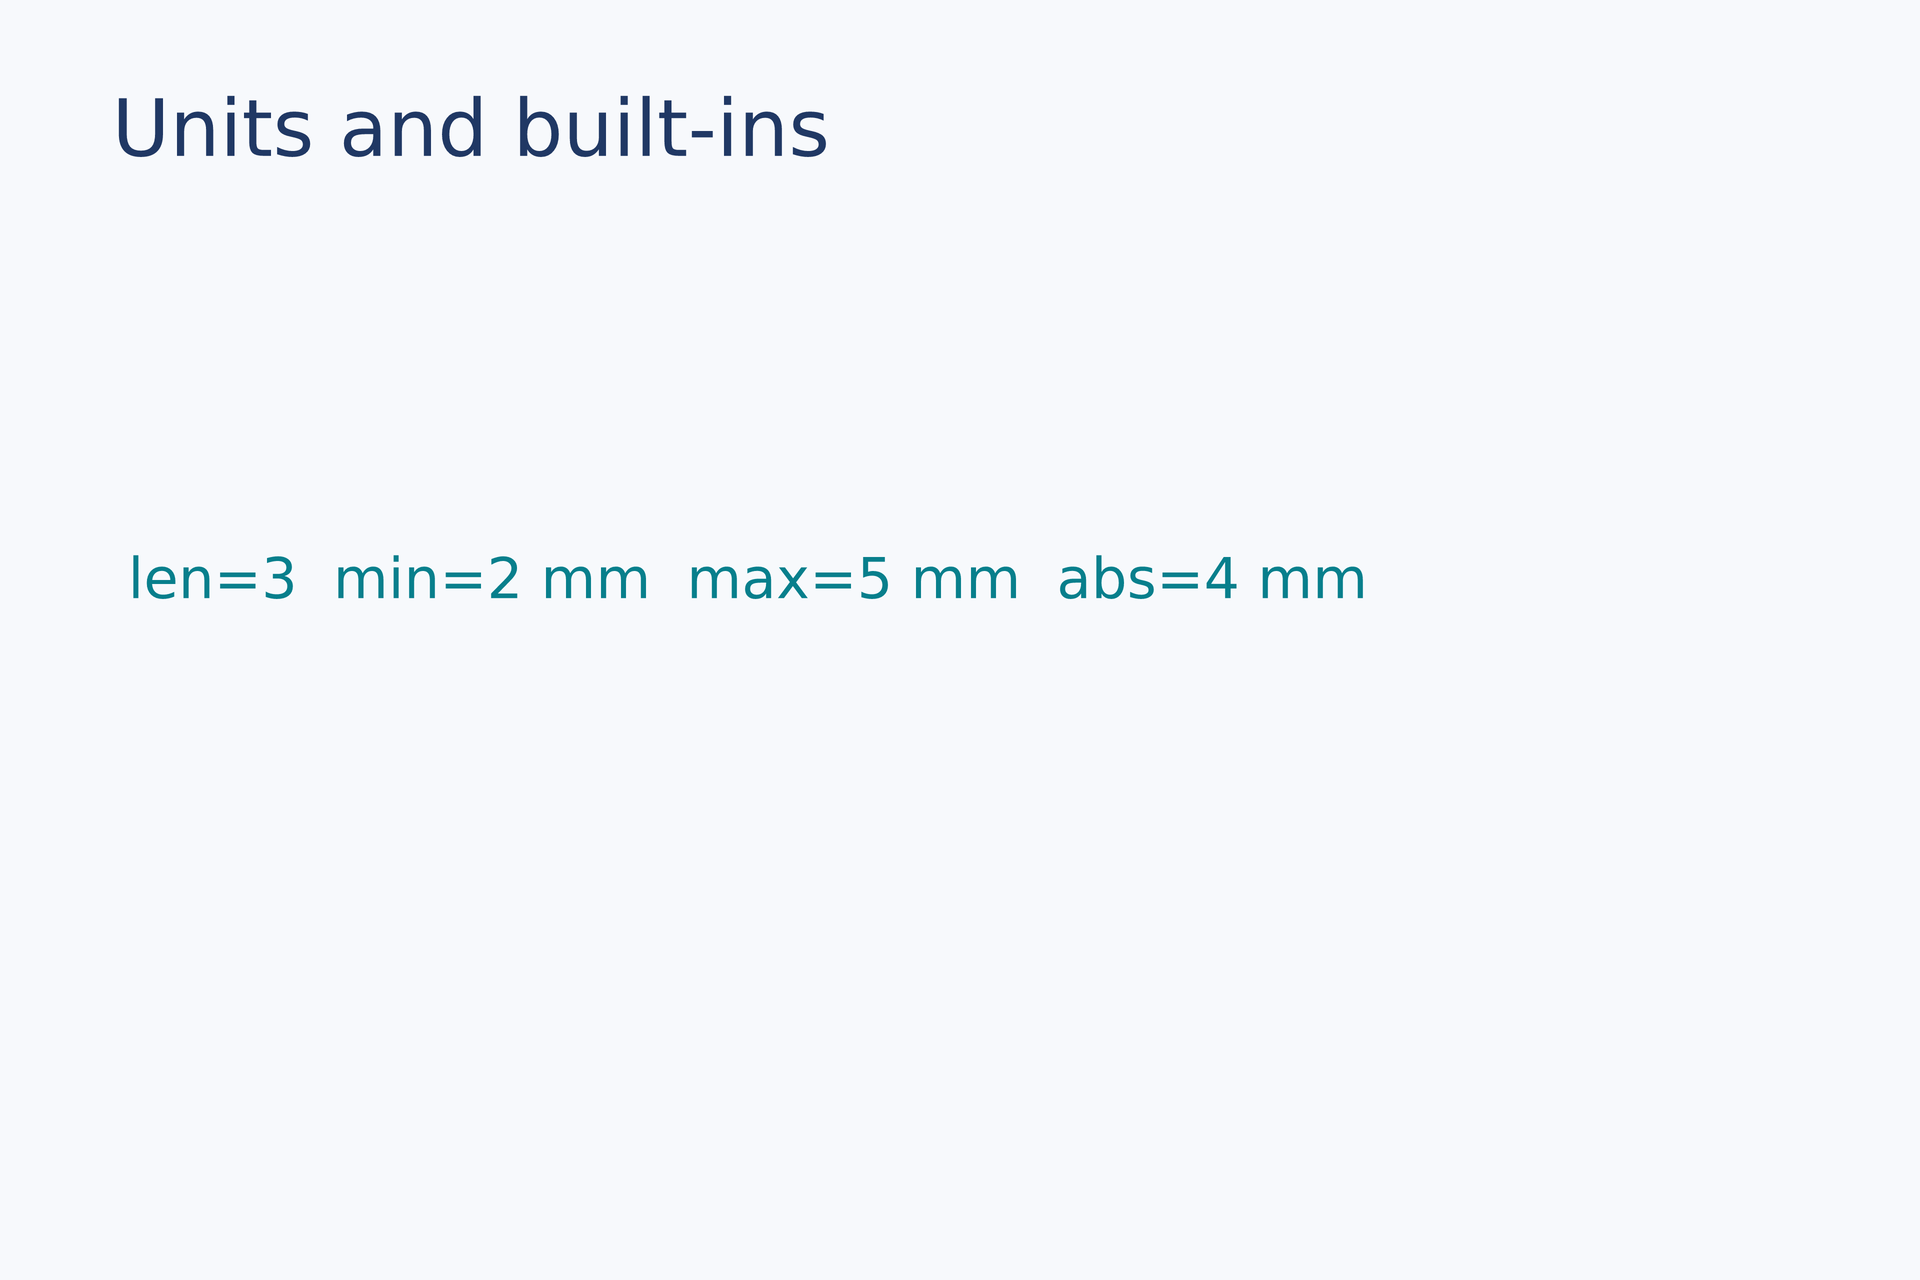
Units and built-ins · Functions and loops
Scientific data plots · 10 examples#
Cartesian, polar and radar plots with fixed physical data areas and manually placed panels and decorations.
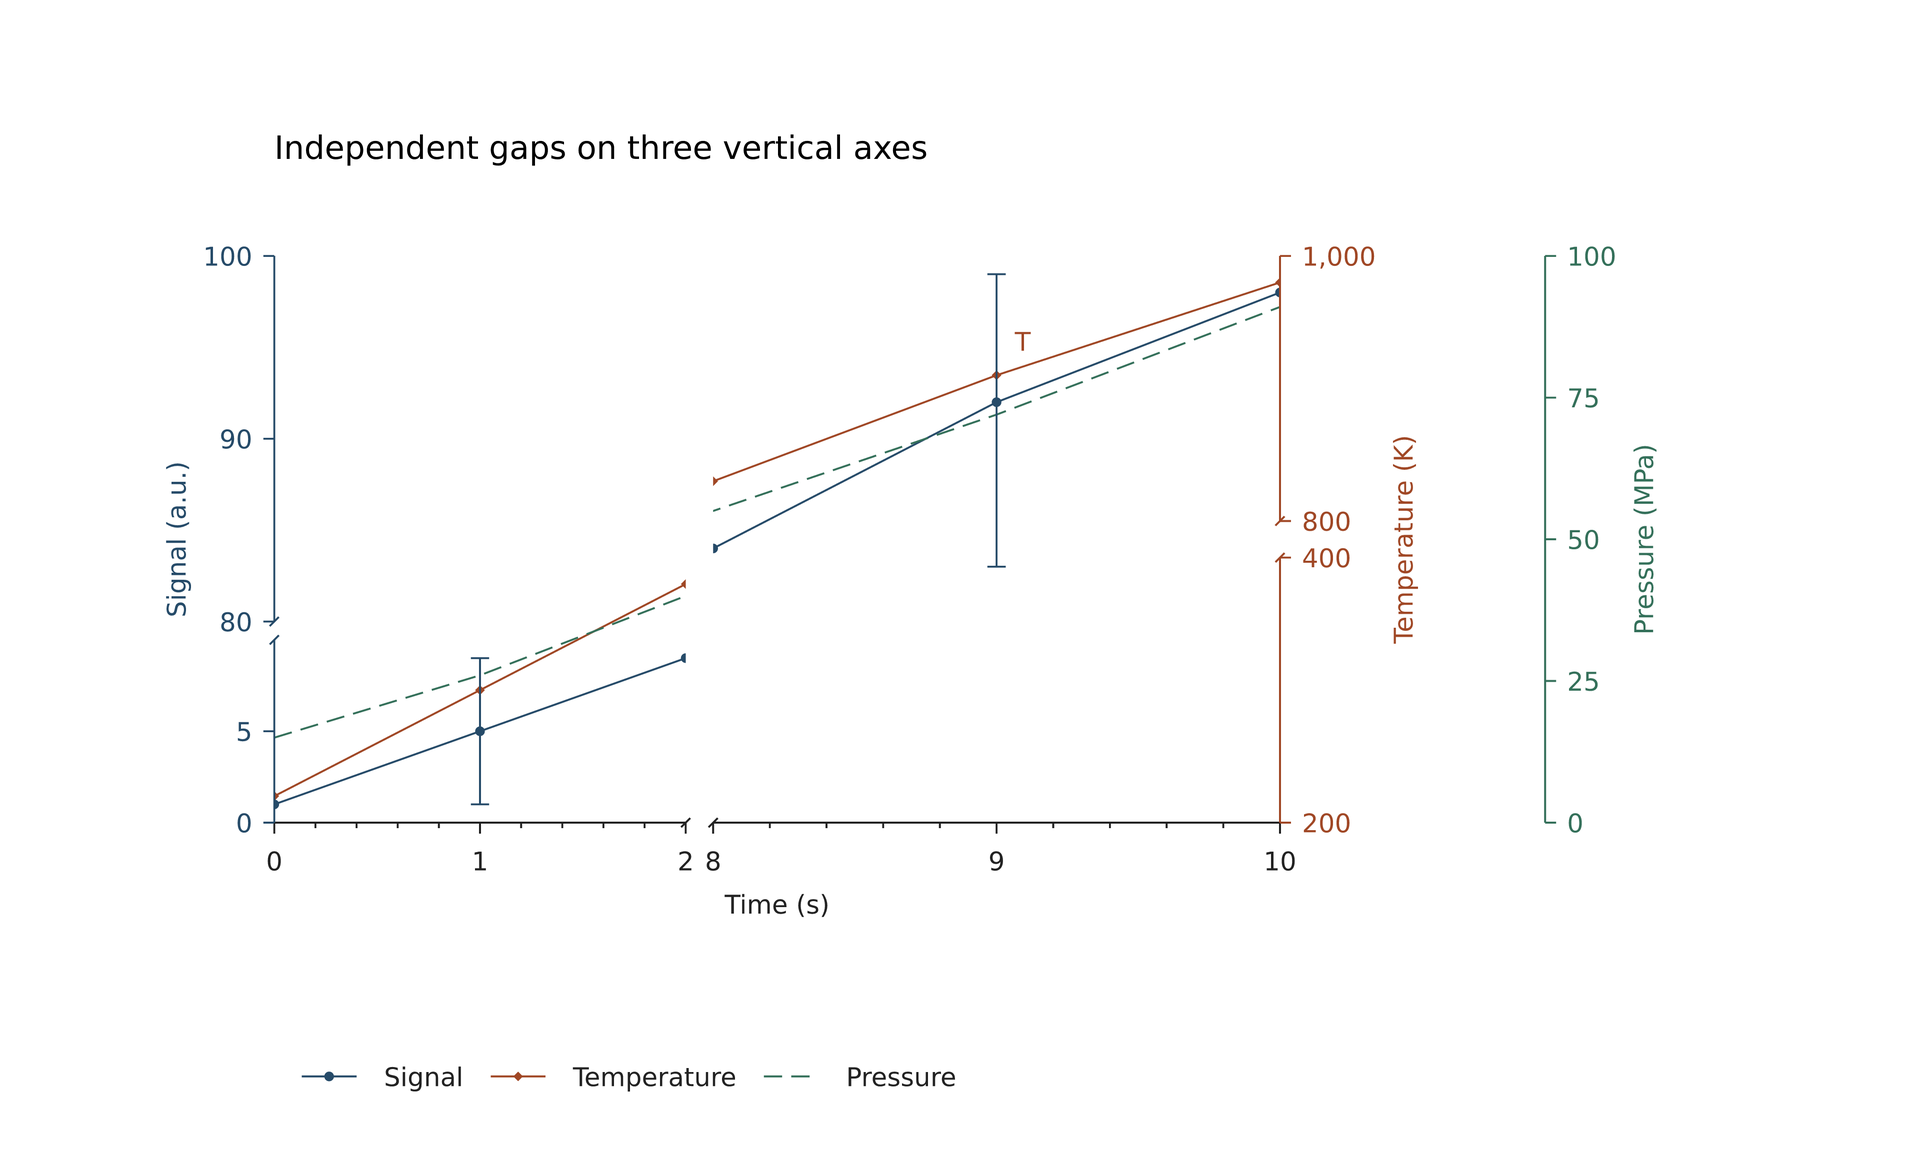
Multiple axes and independent gaps · Layers and descriptive statistics · Shared colors and independent colorbar · Manual inset · Directional curves and signed radii · Polar uncertainty and caps · Angular histograms and annular bars · Polar cells and periodic contours · Radar charts in original units · Polar and radar data from Python
More examples#
Native scientific plots and output · Matplotlib and Notebook output · Eight complete examples · Execution results and tests