 LayMesh
Publication
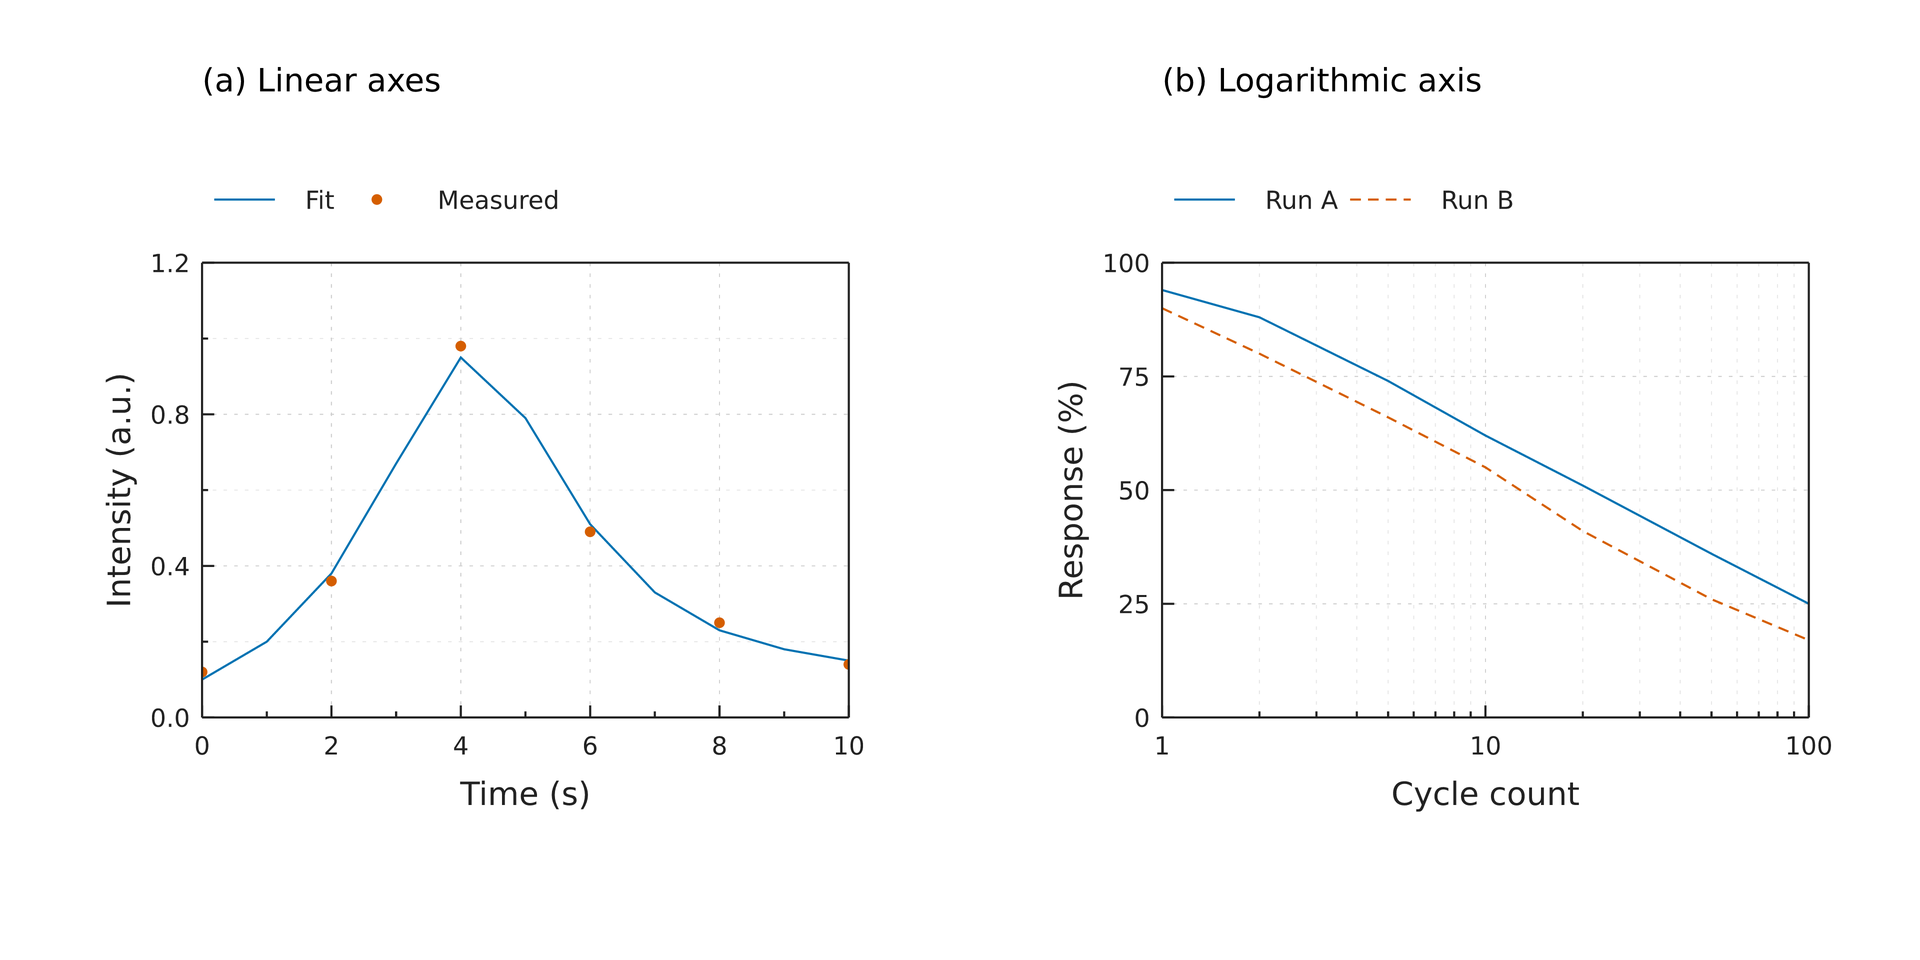
# Each data rectangle is explicitly 64 x 45 mm. Placement uses data-area anchors.# Changing ticks, label sizes or legends never aligns or resizes the other panel.page = canvas(size=(190 mm, 95 mm), background="#ffffff")style = plot_style(font_family="DejaVu Sans", font_size=8 pt, tick_font_size=7 pt, label_font_size=9 pt, grid_color="#d0d0d0", grid_line_width=0.3 pt, grid_line_dash=[1 pt, 2 pt]) left = plot(size=(87 mm, 82 mm), plot_area=box(offset=(17 mm, 18 mm), size=(64 mm, 45 mm)), frame= box, x=axis(label="Time (s)", range=(0, 10), ticks=[0, 2, 4, 6, 8, 10], minor_ticks=[1, 3, 5, 7, 9], tick_direction= in, grid= major), y=axis(label="Intensity (a.u.)", range=(0, 1.2), ticks=[0, 0.4, 0.8, 1.2], format=".1f", minor_ticks=[0.2, 0.6, 1.0], tick_direction= in, grid= both), style=style)left.line(x=[0, 1, 2, 3, 4, 5, 6, 7, 8, 9, 10], y=[0.1, 0.2, 0.38, 0.67, 0.95, 0.79, 0.51, 0.33, 0.23, 0.18, 0.15], label="Fit")# Each data rectangle is explicitly 64 x 45 mm. Placement uses data-area anchors.# Changing ticks, label sizes or legends never aligns or resizes the other panel.page = canvas(size=(190 mm, 95 mm), background="#ffffff")style = plot_style(font_family="DejaVu Sans", font_size=8 pt, tick_font_size=7 pt, label_font_size=9 pt, grid_color="#d0d0d0", grid_line_width=0.3 pt, grid_line_dash=[1 pt, 2 pt]) left = plot(size=(87 mm, 82 mm), plot_area=box(offset=(17 mm, 18 mm), size=(64 mm, 45 mm)), frame= box, x=axis(label="Time (s)", range=(0, 10), ticks=[0, 2, 4, 6, 8, 10], minor_ticks=[1, 3, 5, 7, 9], tick_direction= in, grid= major), y=axis(label="Intensity (a.u.)", range=(0, 1.2), ticks=[0, 0.4, 0.8, 1.2], format=".1f", minor_ticks=[0.2, 0.6, 1.0], tick_direction= in, grid= both), style=style)left.line(x=[0, 1, 2, 3, 4, 5, 6, 7, 8, 9, 10], y=[0.1, 0.2, 0.38, 0.67, 0.95, 0.79, 0.51, 0.33, 0.23, 0.18, 0.15], label="Fit")left.scatter(x=[0, 2, 4, 6, 8, 10], y=[0.12, 0.36, 0.98, 0.49, 0.25, 0.14], color="#D55E00", marker_size=3 pt, label="Measured")left.legend(position=(0 mm, -9 mm), columns=2, font_size=7 pt, background="none")a = page.add(left, anchor= plot_top_left, offset=(20 mm, 26 mm)) right = plot(size=(87 mm, 82 mm), plot_area=box(offset=(17 mm, 18 mm), size=(64 mm, 45 mm)), frame= box, x=axis(label="Cycle count", scale= log, range=(1, 100), ticks=[1, 10, 100], format=".0f", minor_ticks=[2, 3, 4, 5, 6, 7, 8, 9, 20, 30, 40, 50, 60, 70, 80, 90], tick_direction= in, grid= both), y=axis(label="Response (%)", range=(0, 100), ticks=[0, 25, 50, 75, 100], format=".0f", tick_direction= in, grid= major), style=style)right.line(x=[1, 2, 5, 10, 20, 50, 100], y=[94, 88, 74, 62, 51, 36, 25], label="Run A")right.line(x=[1, 2, 5, 10, 20, 50, 100], y=[90, 80, 66, 55, 41, 26, 17], line_dash=[3 pt, 2 pt], label="Run B")right.legend(position=(0 mm, -9 mm), columns=2, font_size=7 pt, background="none")b = page.add(right, anchor= plot_top_left, offset=(115 mm, 26 mm)) page.add(text(content="(a) Linear axes", font_family="DejaVu Sans", font_size=9 pt), target=a.plot_top_left, offset=(0 mm, -20 mm))page.add(text(content="(b) Logarithmic axis", font_family="DejaVu Sans", font_size=9 pt), target=b.plot_top_left, offset=(0 mm, -20 mm))Preview
Background
Dependencies
examples/plot/publication.lay
Reproduce
laymesh validate examples/plot/publication.laylaymesh render examples/plot/publication.lay -o figure.svglaymesh render examples/plot/publication.lay -o figure.pdflaymesh render examples/plot/publication.lay -o figure.png --dpi 300