 LayMesh
Scientific
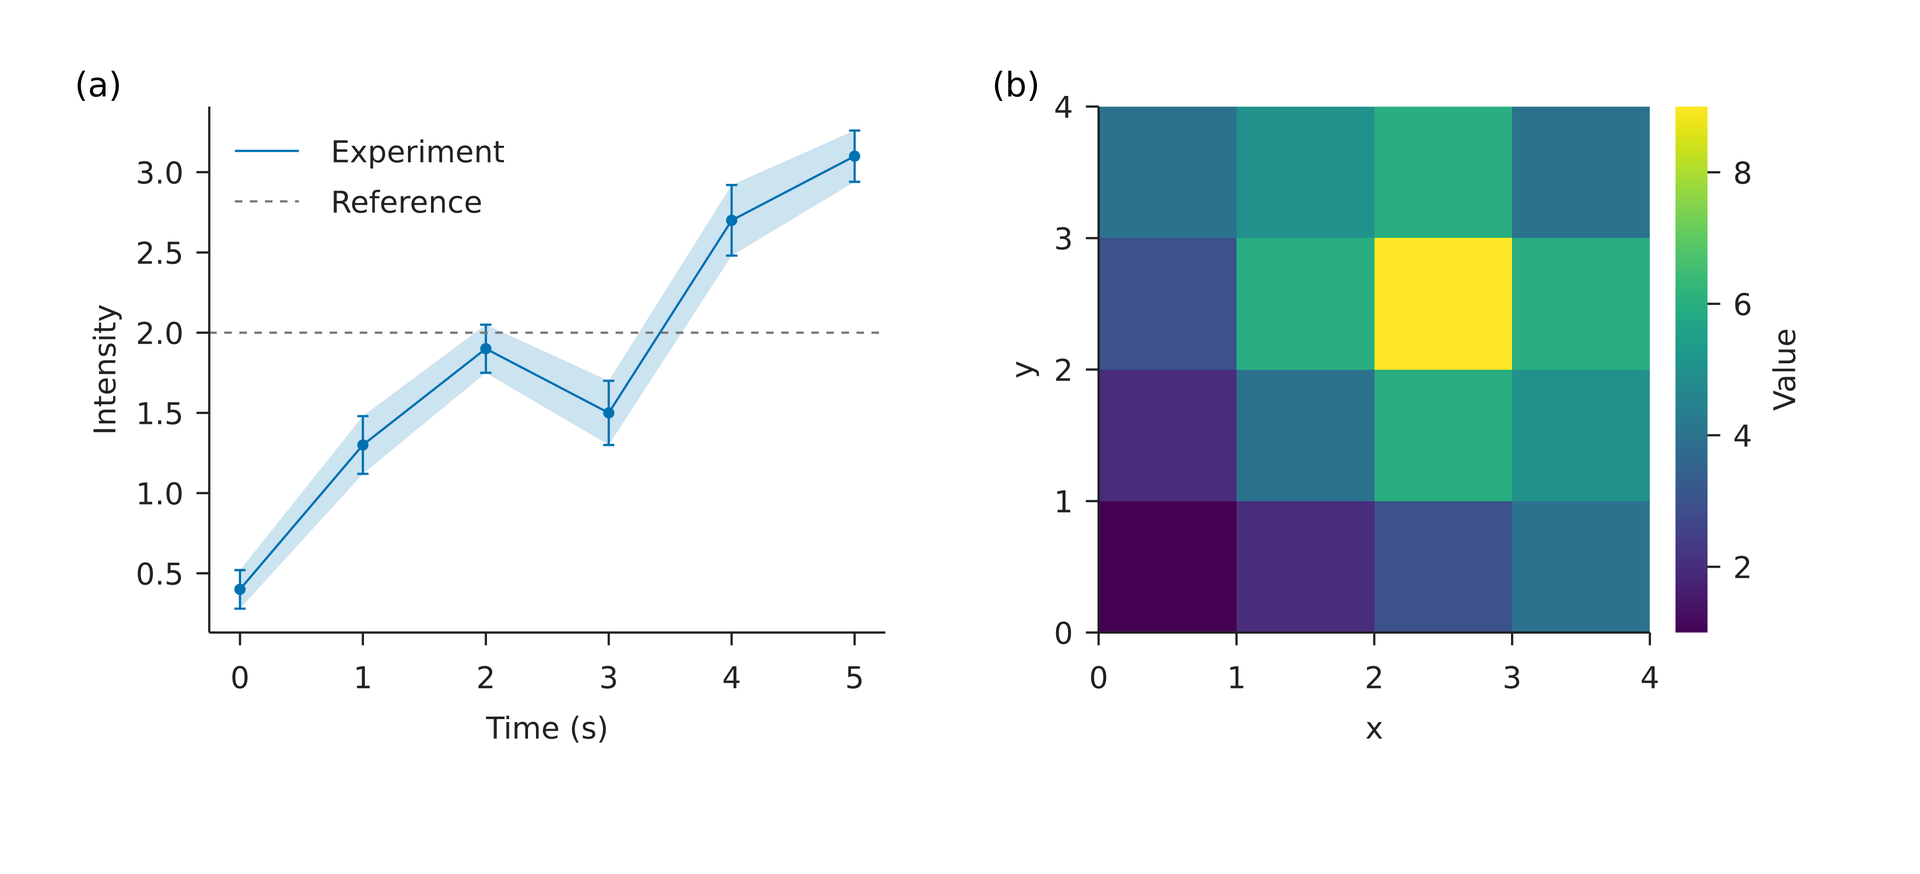
page = canvas(size=(180 mm, 82 mm), background="#ffffff")d = table(src="results.csv")style = plot_style(font_family="DejaVu Sans", font_size=8 pt, line_width=0.6 pt)p = plot(size=(80 mm, 65 mm), x=axis(label="Time (s)"), y=axis(label="Intensity"), style=style)p.band(x=d["time"], lower=d["lower"], upper=d["upper"], color="#0072B2")p.line(x=d["time"], y=d["signal"], color="#0072B2", label="Experiment")p.scatter(x=d["time"], y=d["signal"], color="#0072B2", marker_size=3 pt)p.errorbar(x=d["time"], y=d["signal"], yerr=d["error"], color="#0072B2")p.hline(y=2, color="#777777", line_dash=[2 pt, 2 pt], label="Reference")p.legend(position= top_left)left = page.add(p, target=page.top_left, offset=(7 mm, 6 mm))h = plot(size=(80 mm, 65 mm), x=axis(label="x"), y=axis(label="y"), style=style)heat = h.heatmap(z=[[1,2,3,4],[2,4,6,5],[3,6,9,6],[4,5,6,4]], extent=(0,4,0,4), origin= lower, cmap="viridis")h.colorbar(heat, label="Value")page = canvas(size=(180 mm, 82 mm), background="#ffffff")d = table(src="results.csv")style = plot_style(font_family="DejaVu Sans", font_size=8 pt, line_width=0.6 pt)p = plot(size=(80 mm, 65 mm), x=axis(label="Time (s)"), y=axis(label="Intensity"), style=style)p.band(x=d["time"], lower=d["lower"], upper=d["upper"], color="#0072B2")p.line(x=d["time"], y=d["signal"], color="#0072B2", label="Experiment")p.scatter(x=d["time"], y=d["signal"], color="#0072B2", marker_size=3 pt)p.errorbar(x=d["time"], y=d["signal"], yerr=d["error"], color="#0072B2")p.hline(y=2, color="#777777", line_dash=[2 pt, 2 pt], label="Reference")p.legend(position= top_left)left = page.add(p, target=page.top_left, offset=(7 mm, 6 mm))h = plot(size=(80 mm, 65 mm), x=axis(label="x"), y=axis(label="y"), style=style)heat = h.heatmap(z=[[1,2,3,4],[2,4,6,5],[3,6,9,6],[4,5,6,4]], extent=(0,4,0,4), origin= lower, cmap="viridis")h.colorbar(heat, label="Value")right = page.add(h, target=left.top_right, offset=(6 mm, 0 mm))page.add(text(content="(a)", font_family="DejaVu Sans", font_size=9 pt), target=left.top_left)page.add(text(content="(b)", font_family="DejaVu Sans", font_size=9 pt), target=right.top_left)time,signal,error,lower,upper0,0.4,0.12,0.28,0.521,1.3,0.18,1.12,1.482,1.9,0.15,1.75,2.053,1.5,0.20,1.30,1.704,2.7,0.22,2.48,2.925,3.1,0.16,2.94,3.26Preview
Background
Dependencies
examples/plot/results.csvexamples/plot/scientific.lay
Reproduce
laymesh validate examples/plot/scientific.laylaymesh render examples/plot/scientific.lay -o figure.svglaymesh render examples/plot/scientific.lay -o figure.pdflaymesh render examples/plot/scientific.lay -o figure.png --dpi 300