 LayMesh
Placement, geometric anchors and path locations#
Purpose and concepts#
Placement states which source point meets which target point and how much offset to add. Nine-point defaults belong to layout bounds. Rounded-rectangle and ellipse box corners often lie off the outline; use path or ink.boundary queries and explicitly index candidates.
Minimal complete example#
Run this file directly with laymesh validate or laymesh render; it contains its own canvas and required definitions.
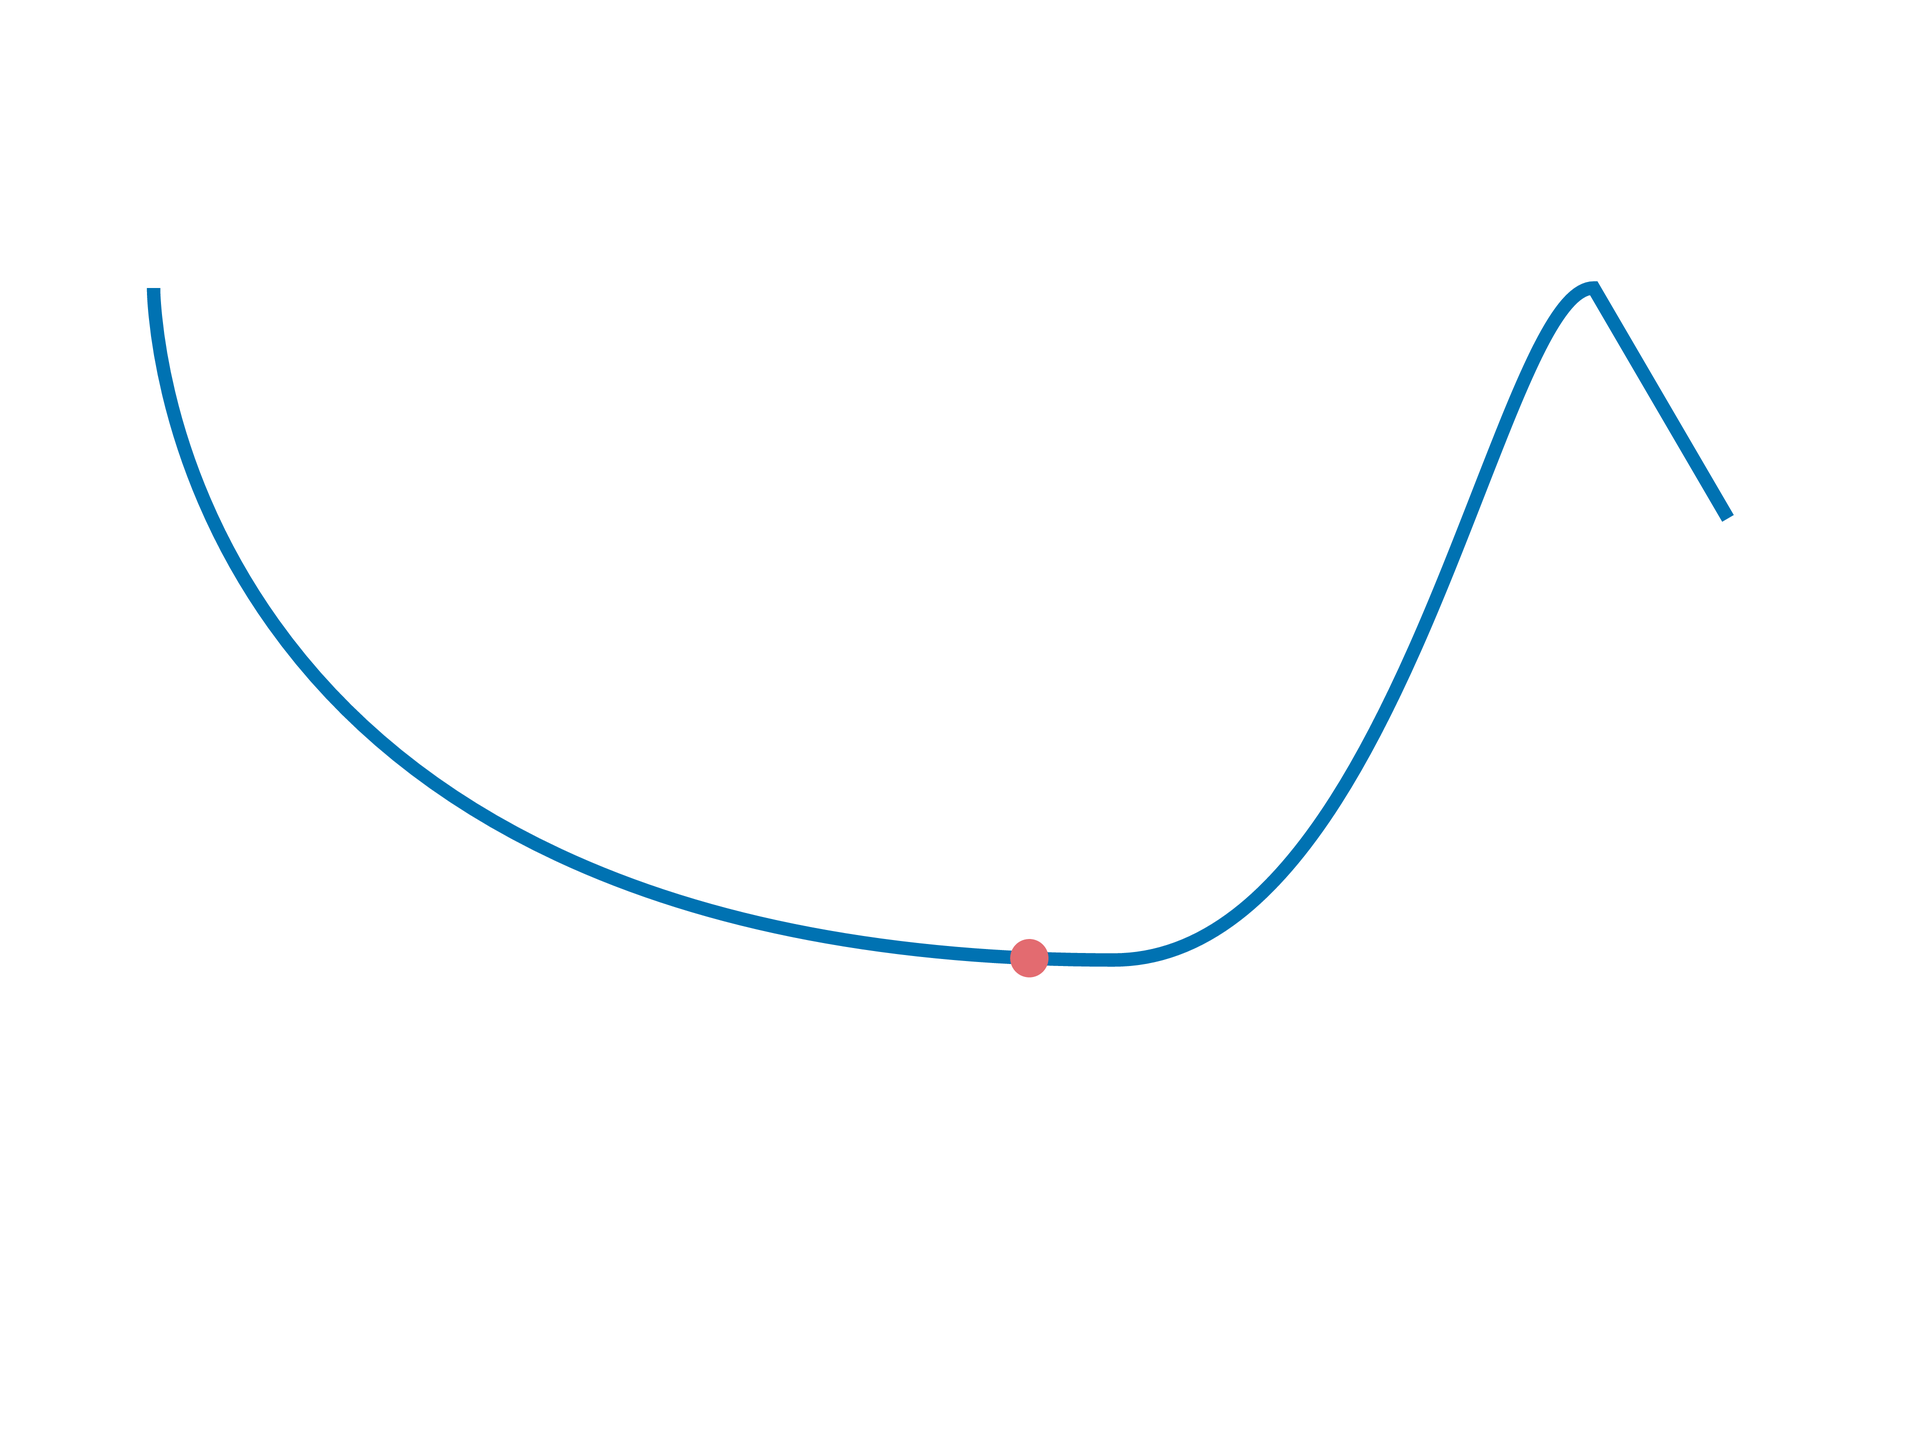
# Minimal complete example: path.atpage=canvas(size=(100mm,75mm),background="#ffffff")curve=page.add(path(commands=[move_to(0mm,0mm),cubic_to(0mm,0mm,0mm,35mm,50mm,35mm),cubic_to(65mm,35mm,70mm,0mm,75mm,0mm),line_to(82mm,12mm)],border_color="#0072b2",border_width=0.7mm),offset=(8mm,15mm))route=curve.path.subpaths[0]dot=ellipse(size=(2mm,2mm),fill="#e36b70")point=route.at(fraction=0.5)page.add(dot,anchor=center,target=point)# Minimal complete example: path.atpage=canvas(size=(100mm,75mm),background="#ffffff")curve=page.add(path(commands=[move_to(0mm,0mm),cubic_to(0mm,0mm,0mm,35mm,50mm,35mm),cubic_to(65mm,35mm,70mm,0mm,75mm,0mm),line_to(82mm,12mm)],border_color="#0072b2",border_width=0.7mm),offset=(8mm,15mm))route=curve.path.subpaths[0]dot=ellipse(size=(2mm,2mm),fill="#e36b70")point=route.at(fraction=0.5)page.add(dot,anchor=center,target=point)Preview
Dependencies
examples/manual/path-at.lay
Parameters and default behavior#
Unitless geometry uses the canvas unit; unitless type and stroke sizes use pt. Explicit call parameters override inherited/theme defaults. The linked interface reference lists accepted types, choices and defaults per parameter.
Composition#
Target a curve’s arc-length midpoint with text and use its tangent_angle for rotation. offset_space=target applies tangent/normal offsets; choose incoming or outgoing at a corner first.
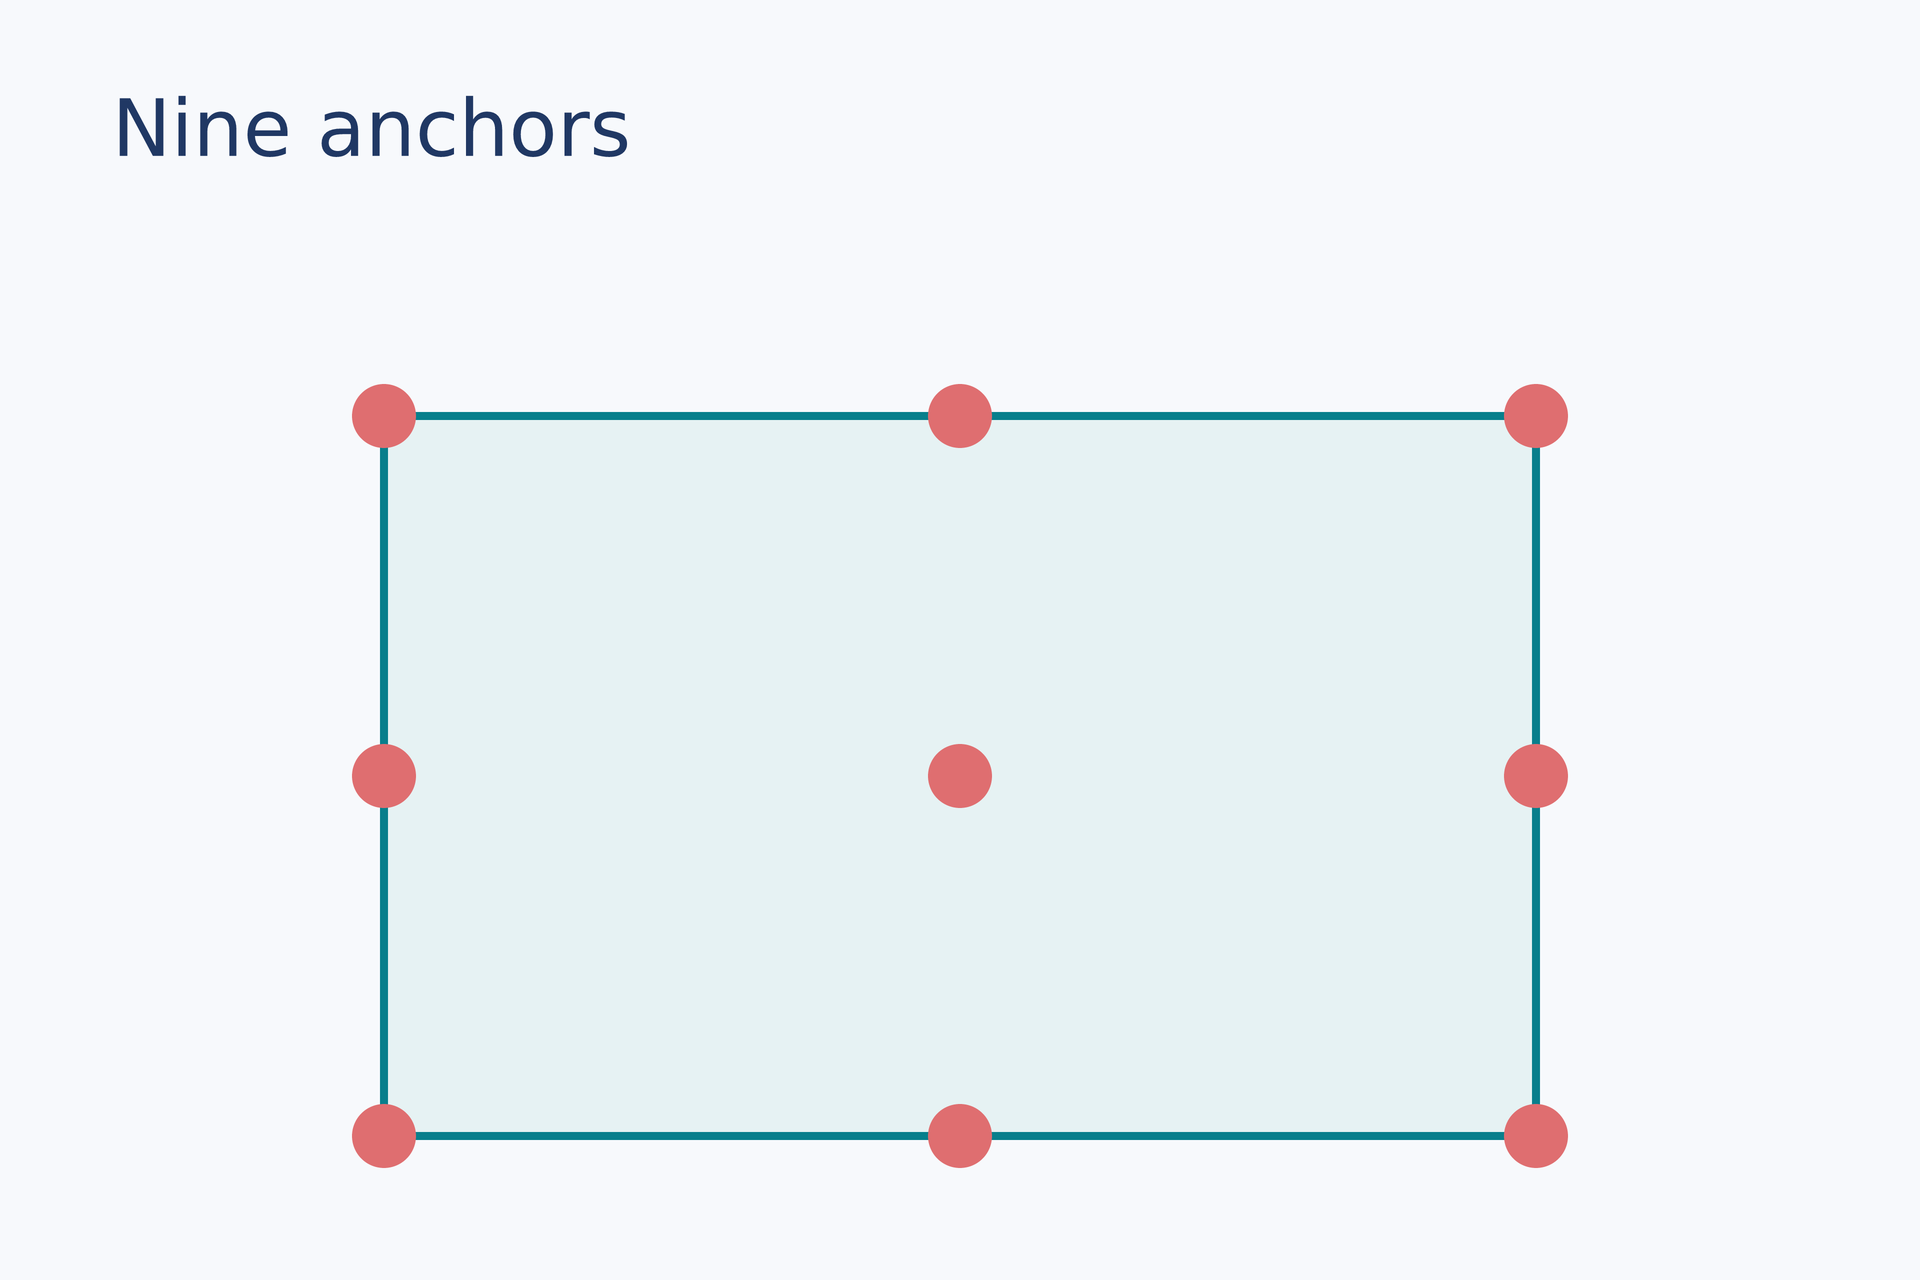
panel = rect(size=(72 mm, 45 mm), fill="#e6f2f3", border_color="#087f8c", border_width=0.5 mm)placed = page.add(panel, target=page.top_left, offset=(24 mm, 26 mm))dot = ellipse(size=(4 mm, 4 mm), fill="#df6e70")page.add(dot, anchor=center, target=placed.top_left)page.add(dot, anchor=center, target=placed.top_center)page.add(dot, anchor=center, target=placed.top_right)page.add(dot, anchor=center, target=placed.middle_left)page.add(dot, anchor=center, target=placed.center)page.add(dot, anchor=center, target=placed.middle_right)page.add(dot, anchor=center, target=placed.bottom_left)page.add(dot, anchor=center, target=placed.bottom_center)page.add(dot, anchor=center, target=placed.bottom_right)# Gallery: positioning / anchorspage = canvas(name="Nine anchors", size=(120 mm, 80 mm), background="#f7f9fc")font = "DejaVu Sans"heading = text(content="Nine anchors", font_family=font, font_size=14 pt, color="#203864")page.add(heading, target=page.top_left, offset=(7 mm, 5 mm))# BEGIN DEMOpanel = rect(size=(72 mm, 45 mm), fill="#e6f2f3", border_color="#087f8c", border_width=0.5 mm)placed = page.add(panel, target=page.top_left, offset=(24 mm, 26 mm))dot = ellipse(size=(4 mm, 4 mm), fill="#df6e70")page.add(dot, anchor=center, target=placed.top_left)page.add(dot, anchor=center, target=placed.top_center)page.add(dot, anchor=center, target=placed.top_right)page.add(dot, anchor=center, target=placed.middle_left)page.add(dot, anchor=center, target=placed.center)page.add(dot, anchor=center, target=placed.middle_right)page.add(dot, anchor=center, target=placed.bottom_left)page.add(dot, anchor=center, target=placed.bottom_center)page.add(dot, anchor=center, target=placed.bottom_right)# END DEMOPreview
Dependencies
examples/gallery/positioning/anchors.lay
Common errors and limits#
A candidate collection cannot be passed directly to target. Indexing an empty collection errors; continuous overlap and infinitely many nearest points are not arbitrarily sampled. self binds only in anchor, and unplaced material cannot serve as a target.
Individual functions#
instance-data#
Select an original-data point on a placed chart. Axis transforms, breaks, instance transforms and group replay resolve the reference again; the point must be in a valid visible domain.
Returns: anchor
Minimal complete source · Composition source · All parameters
instance-axis#
Select a named chart axis at its numeric start, physical midpoint or numeric end. Legacy transforms are retained; axes[name].spine.path provides explicit spine queries.
Returns: anchor
Minimal complete source · Composition source · All parameters
add#
Place material in a canvas or group. Align its anchor to a target with an offset. Reuse the same material with independent size and styling for each placement.
Returns: A placed instance with measured dimensions and anchors for subsequent placement.
Required inputs: material.
Minimal complete source · Composition source · All parameters
ray#
Create a query ray with an origin and nonzero direction. The origin shares the path container; direction uses the selected measurement space.
Returns: ray
Required inputs: origin, direction.
Minimal complete source · Composition source · All parameters
path-at#
Select by arc-length fraction or distance. Original parameter t requires segments[i]. Lengths use placed geometry by default.
Returns: path_anchor
Minimal complete source · Composition source · All parameters
path-nearest#
Return all globally nearest path positions in source order. Explicit indexing is required; infinitely many nearest points are diagnosed.
Returns: anchor_collection
Required inputs: to.
Minimal complete source · Composition source · All parameters
path-extrema#
Return local coordinate extrema in the selected space, excluding ordinary endpoints and constant intervals.
Returns: anchor_collection
Minimal complete source · Composition source · All parameters
path-inflections#
Return smooth inflections where signed curvature changes sign.
Returns: anchor_collection
Minimal complete source · Composition source · All parameters
path-corners#
Return nonsmooth joining nodes; choose direction explicitly with with_side.
Returns: anchor_collection
Minimal complete source · Composition source · All parameters
path-intersections#
Return all path positions intersecting a ray. Preserve distinct self-intersection occurrences and diagnose continuous overlap.
Returns: anchor_collection
Required inputs: ray.
Minimal complete source · Composition source · All parameters
path-between#
Select a continuous interval in traversal order. Endpoints must belong to the same instance and subpath.
Returns: geometry_path
Minimal complete source · Composition source · All parameters
path-in_space#
Choose the measurement space for lengths, nearest points and features. Resulting anchors remain in the current container.
Returns: geometry_path
Minimal complete source · Composition source · All parameters
anchor-with_side#
Choose the incoming or outgoing direction at a corner. The positive normal is the left side along traversal.
Returns: path_anchor
Minimal complete source · Composition source · All parameters
Detailed behavior and further examples#
Three geometry views#
| View | Meaning | Use |
|---|---|---|
bounds |
Existing axis-aligned layout box, excluding stroke | Layout, alignment and spacing |
path |
Closed shape outline or logical line centerline | Connections, curve annotations and nodes |
ink |
Fill and stroke region, including caps, dashes and arrowheads | Drawing-edge placement and occupied bounds |
The nine shortcuts such as placed.top_left retain their meaning and equal placed.bounds.top_left. path.bounds and ink.bounds tightly enclose their respective geometry. Box corners need not lie on the shape. Select a box corner and a rounded rectangle or ellipse boundary separately:
page.add(dot, anchor=center, target=placed.bounds.top_left)page.add(dot, anchor=center, target=placed.path.nearest(to=placed.bounds.top_left)[0])page.add(dot, anchor=center, target=placed.ink.boundary.nearest(to=placed.bounds.top_left)[0])An arrow's path represents the complete logical centerline, including the portion under its head. A line's path.bounds may have zero height; ink.bounds includes width, caps and the head. These views cover native vector geometry. Images and text retain bounds; no pixel or glyph outlines are extracted.
Nodes, segments and points along a route#
route = curve.path.subpaths[0]route.startroute.endroute.nodes[2]route.segments[1].controls[0] # May lie off the curve; has no path directionroute.at(fraction=0.5) # Half the subpath's arc lengthroute.at(distance=10 mm) # Arc length from the startroute.segments[1].at(t=0.5) # Original curve parameter, not arc-length fractionroute.between(route.nodes[1], route.nodes[3]).at(fraction=0.5)Nodes and segment indices follow original geometry rather than rendering subdivisions. One arc_to remains one logical segment. Continuous traversal across multiple subpaths requires selecting subpaths[i] first. Closed paths preserve their start and traversal direction; start and end can coincide. Crossing the closed seam requires between(..., wrap=true). Interval endpoints must belong to the same instance, geometric path and subpath; coincident instances cannot exchange endpoints.
The default measurement space is the current container: nonuniform resizing changes lengths, nearest points and extrema. route.in_space("local") measures original local geometry; in_space("parent") restores container measurements. Results always become anchors in the current container. Bounds shortcuts use the rectangle in the selected measurement space.
Searches always return collections#
route.nearest(to=another.bounds.center)[0]route.extrema(axis="y")[0]route.inflections()[0]route.corners()[0]route.intersections(ray(origin=another.bounds.center, direction=(1, 0)))[0]Explicit indexing is required before passing a collection to target, even for one candidate. No matches produce an empty collection; invalid indices report E_INDEX. Check len(candidates) or iterate with for point in candidates. Candidates sort by subpath, original segment and parameter. Shared joining nodes are deduplicated; distinct path positions at a self-intersection remain distinct. Continuous overlap and infinitely many globally nearest points report E_GEOMETRY rather than inventing a finite sample.
extrema finds local coordinate extrema in the selected space, excluding ordinary endpoints and constant intervals. inflections finds smooth signed-curvature changes; corners finds nonsmooth joining nodes. Rays select their forward half only. Their nonzero direction is interpreted in the path's selected measurement space.
Source selectors, direction and offsets#
point = placed.path.at(fraction=0.5)page.add(curve, anchor=self.path.start, target=point, offset=(2 mm, 3 mm), offset_space="target", rotation=point.tangent_angle)self is a symbolic source root, bound only in anchor after sizing and transforms. Source selectors cannot depend on another instance. Existing nine-point names and anchor="start"/"end" preserve their transform semantics.
Path anchors expose tangent, normal (two dimensionless components), and tangent_angle. The positive normal is the left side along traversal: a rightward tangent has an upward normal in page coordinates. Ambiguous corner or cusp directions require point.with_side("incoming") or with_side("outgoing"); unspecified direction queries report E_ANCHOR_DIRECTION. start/end use outgoing/incoming direction respectively. Position alone requires no direction.
| Parameter | Meaning | Default |
|---|---|---|
anchor |
Layout anchor name or self geometry selector |
top_left |
target |
Placed-instance anchor in the same container | Container top left |
offset |
Two physical-length components | (0 mm, 0 mm) |
offset_space |
container: container axes; target: target tangent and left normal |
container |
rotation |
Rotation about the instance center, including point.tangent_angle |
0deg |
Chart components#
chart.plot_area.bounds.top_leftchart.axes["x"].bounds.bottom_center # Complete spine, ticks and title componentchart.axes["x"].spine.path.at(fraction=0.5)chart.axes["x"].label.bounds.centerchart.axes["x"].min # Numeric domain minimumchart.axes["x"].max # Numeric domain maximumchart.data(x=2, y=1.8)Axis shortcuts select the complete component layout box; select spine for the axis line alone. Horizontal, vertical and top/bottom/left/right axes share this model. min/max name numerical domain endpoints and preserve their meaning on reversed axes. A broken spine has multiple subpaths, so select one before continuous traversal. Existing plot_* and axis(name="x",anchor="center") syntax preserves its transform semantics.
References retain instance identity, component and selection conditions. Group replay and chart reflow recompute paths, components, data anchors and directly read measurements such as tangent_angle.
Complete interface · Units and sizes · Transforms · Groups
geometry-model#
The reference lists every view member and method. Original identity and measurement rules are described above; select .subpaths[i] before continuously traversing a compound path.
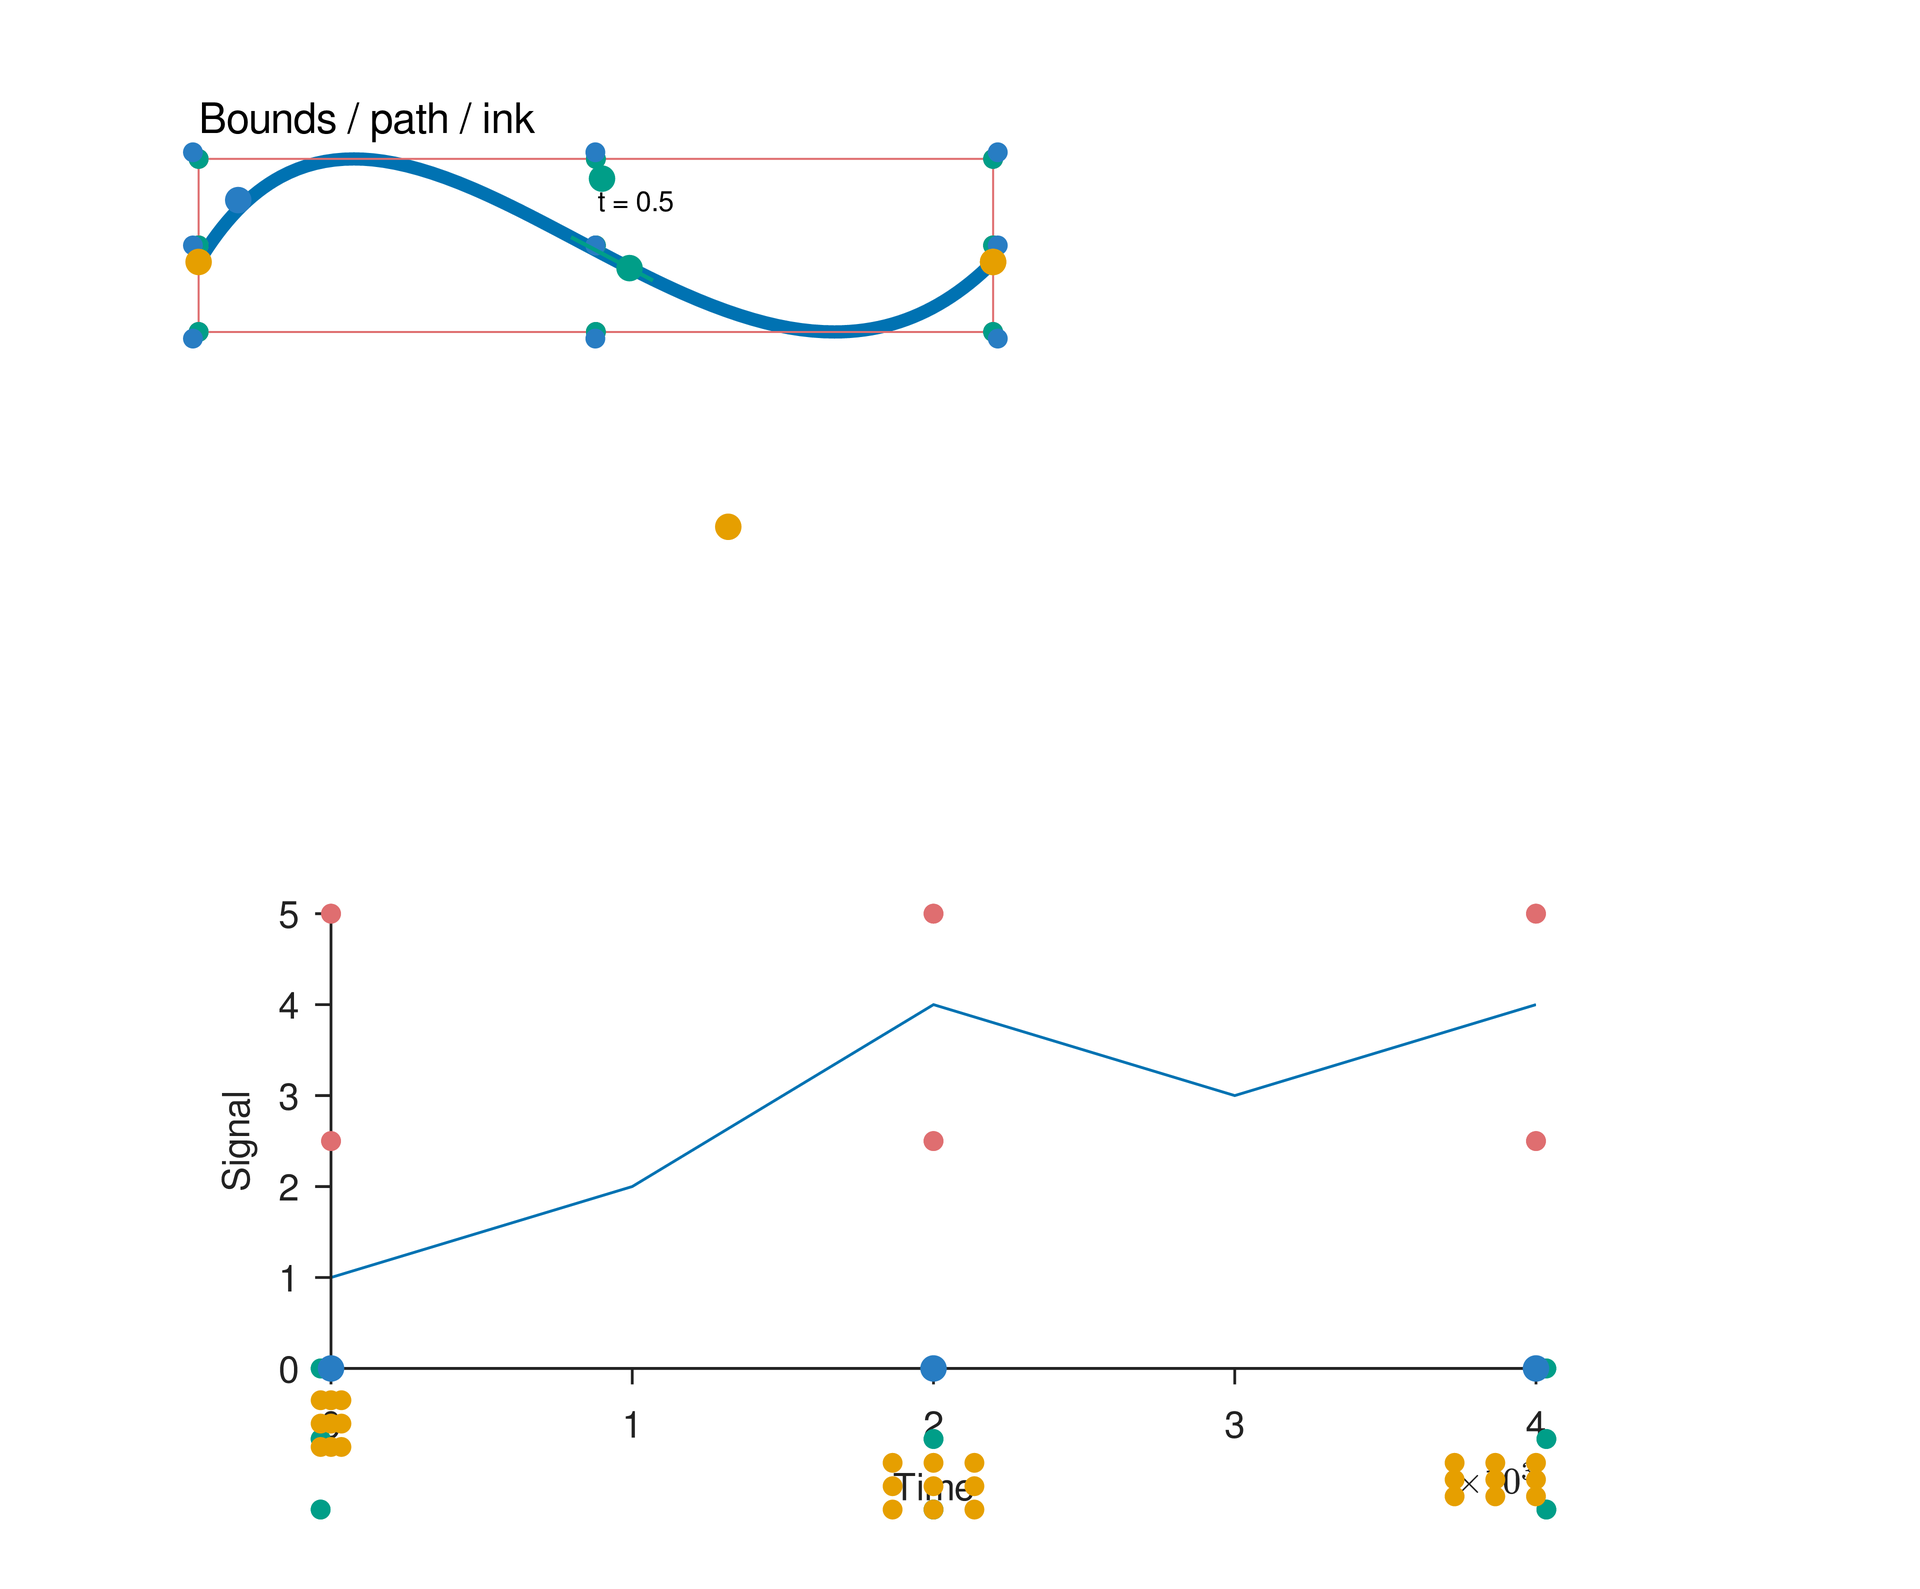
The example below reads the instance, layout box, original path and painted region separately. The same nine-point interface also works on plot areas, complete axes, labels, ticks and exponent labels. Red dots mark layout frames, blue dots mark the painted boundary, and yellow dots mark control points and axis labels. Select controls with .segments[i].controls[j]; they provide positions and usually lie off the curve.
# Views retain their own meaning even though they share the nine-point API.page=canvas(size=(145mm,120mm),background="#ffffff")function mark_frame(view,color) { for location in [view.top_left,view.top_center,view.top_right, view.middle_left,view.center,view.middle_right, view.bottom_left,view.bottom_center,view.bottom_right] { page.add(ellipse(size=(1.5mm,1.5mm),fill=color),anchor=center,target=location) }}curve=page.add(path(commands=[move_to(0mm,20mm), cubic_to(15mm,-5mm,40mm,40mm,60mm,20mm)], border_color="#0072b2",border_width=1mm),offset=(15mm,12mm))marked=mark_frame(curve,"#df6e70")layout=curve.bounds# Views retain their own meaning even though they share the nine-point API.page=canvas(size=(145mm,120mm),background="#ffffff")function mark_frame(view,color) { for location in [view.top_left,view.top_center,view.top_right, view.middle_left,view.center,view.middle_right, view.bottom_left,view.bottom_center,view.bottom_right] { page.add(ellipse(size=(1.5mm,1.5mm),fill=color),anchor=center,target=location) }}curve=page.add(path(commands=[move_to(0mm,20mm), cubic_to(15mm,-5mm,40mm,40mm,60mm,20mm)], border_color="#0072b2",border_width=1mm),offset=(15mm,12mm))marked=mark_frame(curve,"#df6e70")layout=curve.boundsmarked=mark_frame(layout,"#df6e70")page.add(rect(size=(layout.width,layout.height),border_color="#df6e70", border_width=0.15mm),target=layout.top_left)marked=mark_frame(curve.path,"#009e88")marked=mark_frame(curve.path.bounds,"#009e88")painted=curve.inkmarked=mark_frame(painted.bounds,"#287dc3")boundary=painted.boundarypage.add(ellipse(size=(2mm,2mm),fill="#287dc3"),anchor=center, target=boundary.nearest(to=layout.top_left)[0]) # List indices refer to original subpaths, segments, nodes and controls.route=curve.path.subpaths[0]same_route=route.pathsegment=route.segments[0]node=route.nodes[1]control=segment.controls[0]all_controls=segment.controlsfor location in [route.start,route.end,node,control,all_controls[1]] { page.add(ellipse(size=(2mm,2mm),fill="#e69f00"),anchor=center,target=location)}point=segment.at(t=0.5)coordinate=(point.x,point.y)page.add(text("t = 0.5",font_size=6pt),offset=(coordinate[0]+2mm,coordinate[1]-4mm))direction=point.tangentleft_normal=point.normalpage.add(line(length=7mm,line_color="#009e88"),anchor=self.path.start, target=point,rotation=point.tangent_angle)page.add(ellipse(size=(2mm,2mm),fill="#009e88"),anchor=center, target=point,offset=(left_normal[0]*5mm,left_normal[1]*5mm))page.add(ellipse(size=(2mm,2mm),fill="#009e88"),anchor=center, target=point,offset=(direction[0]*5mm,direction[1]*5mm))box_point=layout.top_leftpage.add(text("Bounds / path / ink",font_size=9pt), offset=(box_point.x,box_point.y-5mm)) # Plot areas, complete axes, labels, ticks and exponent labels are components.p=plot(size=(105mm,50mm),x=axis(range=(0,4000),notation=offset, exponent=3,label="Time"),y=axis(range=(0,5),label="Signal"))p.line(x=[0,1000,2000,3000,4000],y=[1,2,4,3,4])chart=page.add(p,offset=(15mm,65mm))area=chart.plot_areamarked=mark_frame(area,"#df6e70")marked=mark_frame(area.bounds,"#df6e70")axes=chart.axeshorizontal=axes["x"]marked=mark_frame(horizontal,"#009e88")marked=mark_frame(horizontal.bounds,"#009e88")marked=mark_frame(horizontal.label,"#e69f00")marked=mark_frame(horizontal.exponent,"#e69f00")tick=horizontal.ticks[0]marked=mark_frame(tick,"#e69f00")for location in [horizontal.min,horizontal.max, horizontal.spine.path.at(fraction=0.5)] { page.add(ellipse(size=(2mm,2mm),fill="#287dc3"),anchor=center,target=location)}Preview
Dependencies
examples/manual/geometry-members.lay
point.x and point.y return physical coordinates in the current container. point.tangent and point.normal return two dimensionless components, accessible with [0] and [1]. Multiply by a physical length to compute an offset; the positive normal follows the left side of traversal. target=point retains the anchor reference; numeric pairs can be used for offset. See the composition source for dependent placement.
workflow#
Complete sources and executable verification fixtures for this workflow are listed in the feature coverage map. Follow this page’s input conditions and limits when composing features.