 LayMesh
Your first data plot#
Purpose and concepts#
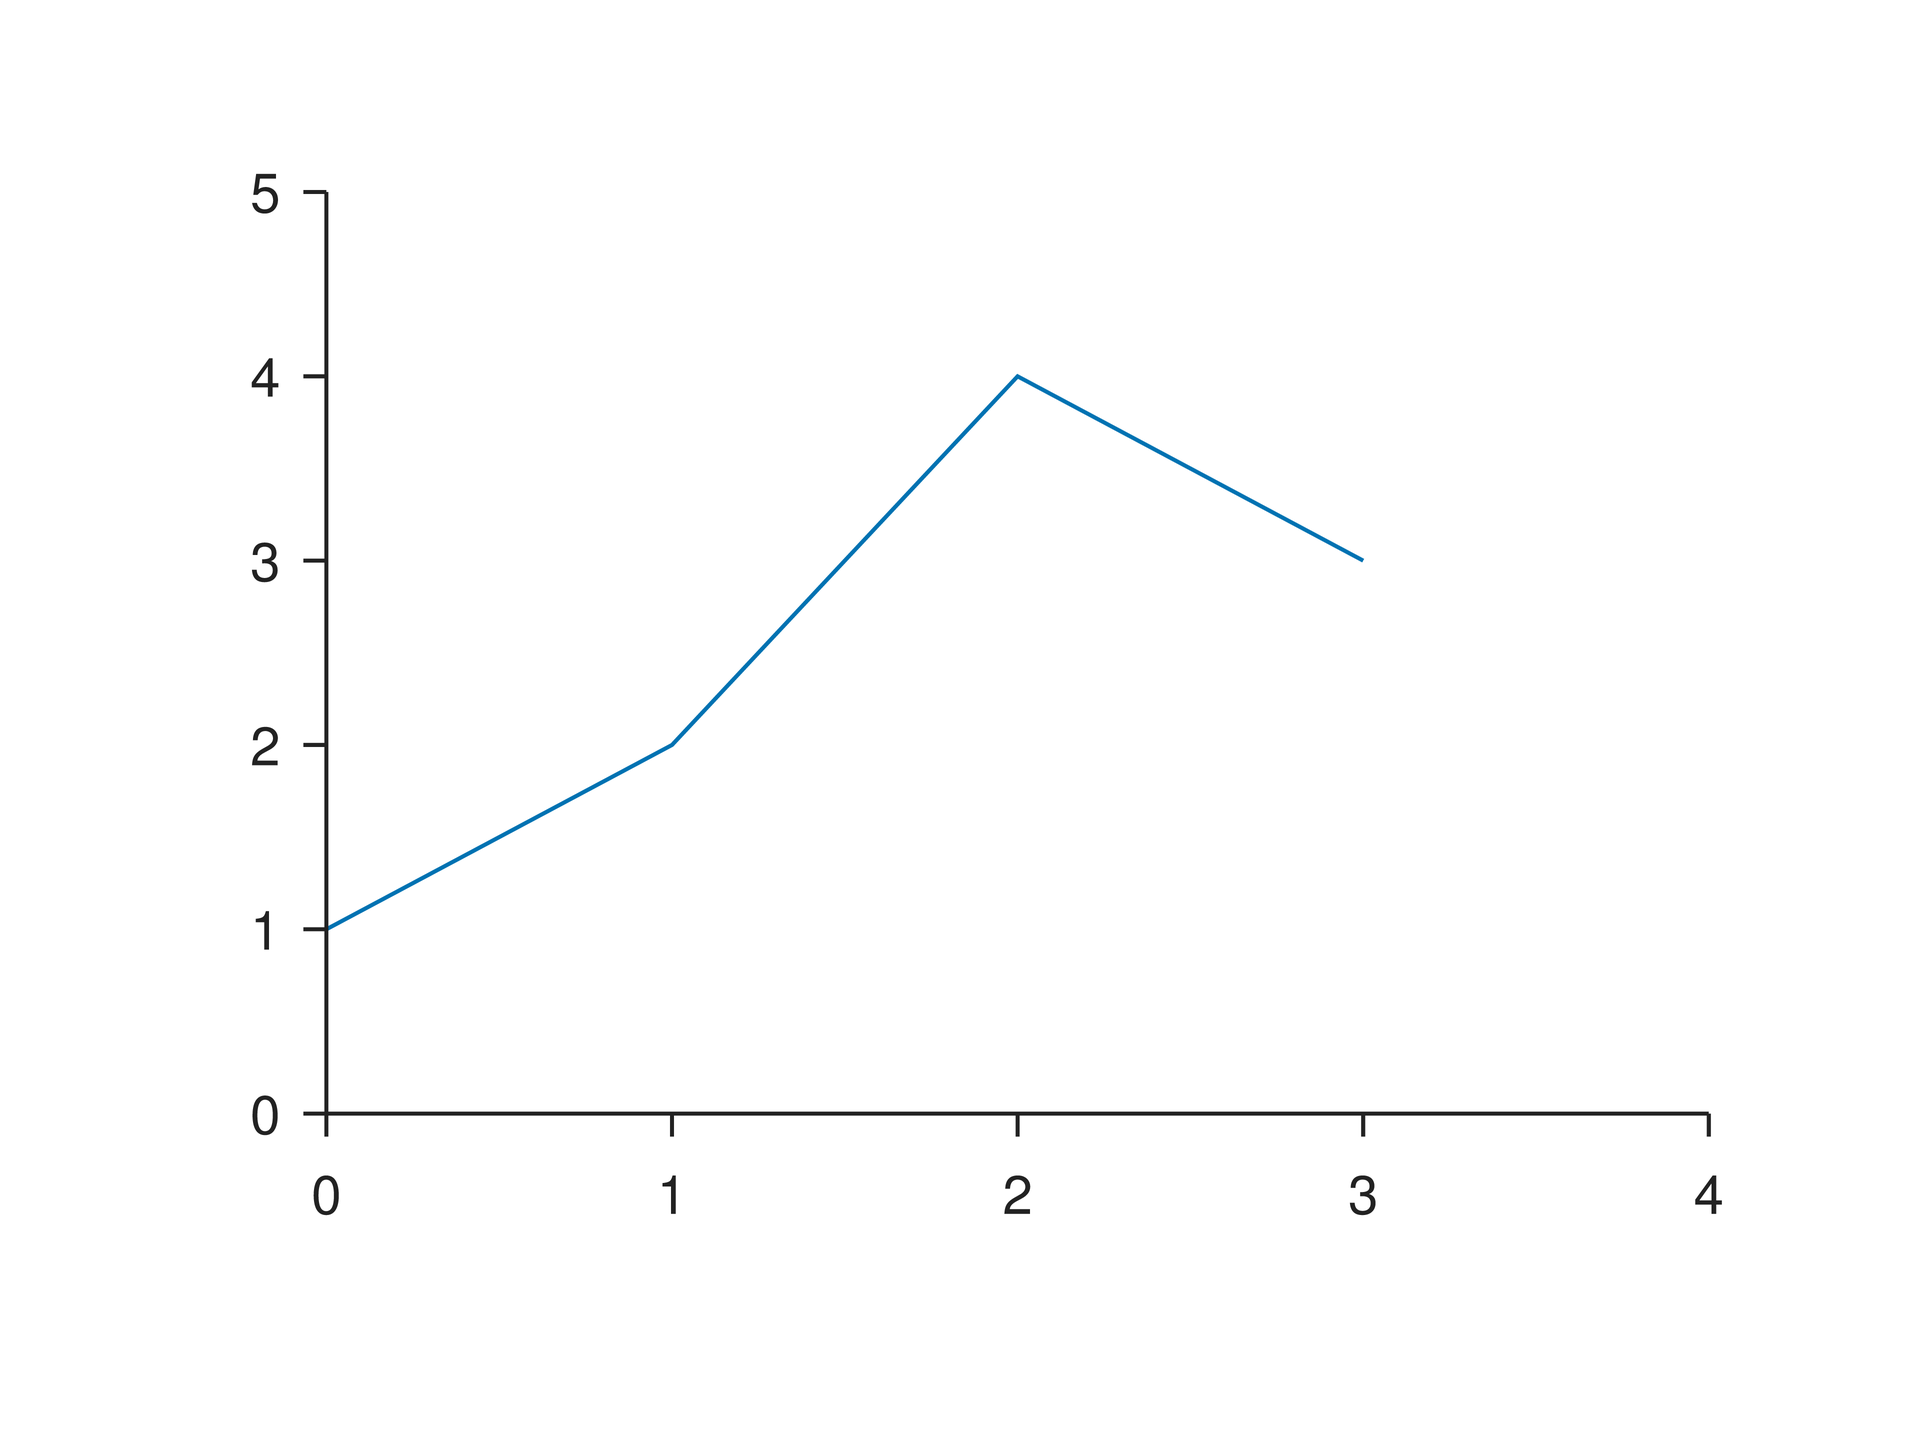
A native chart is vector material, not an imported image. Create plot, add layers and decorations, then place it. Axes map data values into the plot area.
Minimal complete example#
Run this file directly with laymesh validate or laymesh render; it contains its own canvas and required definitions.
# Minimal complete example: plotpage=canvas(size=(100mm,75mm),background="#ffffff")p=plot(size=(86mm,62mm),x=axis(range=(0,4)),y=axis(range=(0,5)))p.line(x=[0,1,2,3],y=[1,2,4,3],label="Signal")page.add(p,offset=(7mm,6mm))# Minimal complete example: plotpage=canvas(size=(100mm,75mm),background="#ffffff")p=plot(size=(86mm,62mm),x=axis(range=(0,4)),y=axis(range=(0,5)))p.line(x=[0,1,2,3],y=[1,2,4,3],label="Signal")page.add(p,offset=(7mm,6mm))Preview
Dependencies
examples/manual/plot.lay
Parameters and default behavior#
Unitless geometry uses the canvas unit; unitless type and stroke sizes use pt. Explicit call parameters override inherited/theme defaults. The linked interface reference lists accepted types, choices and defaults per parameter.
Composition#
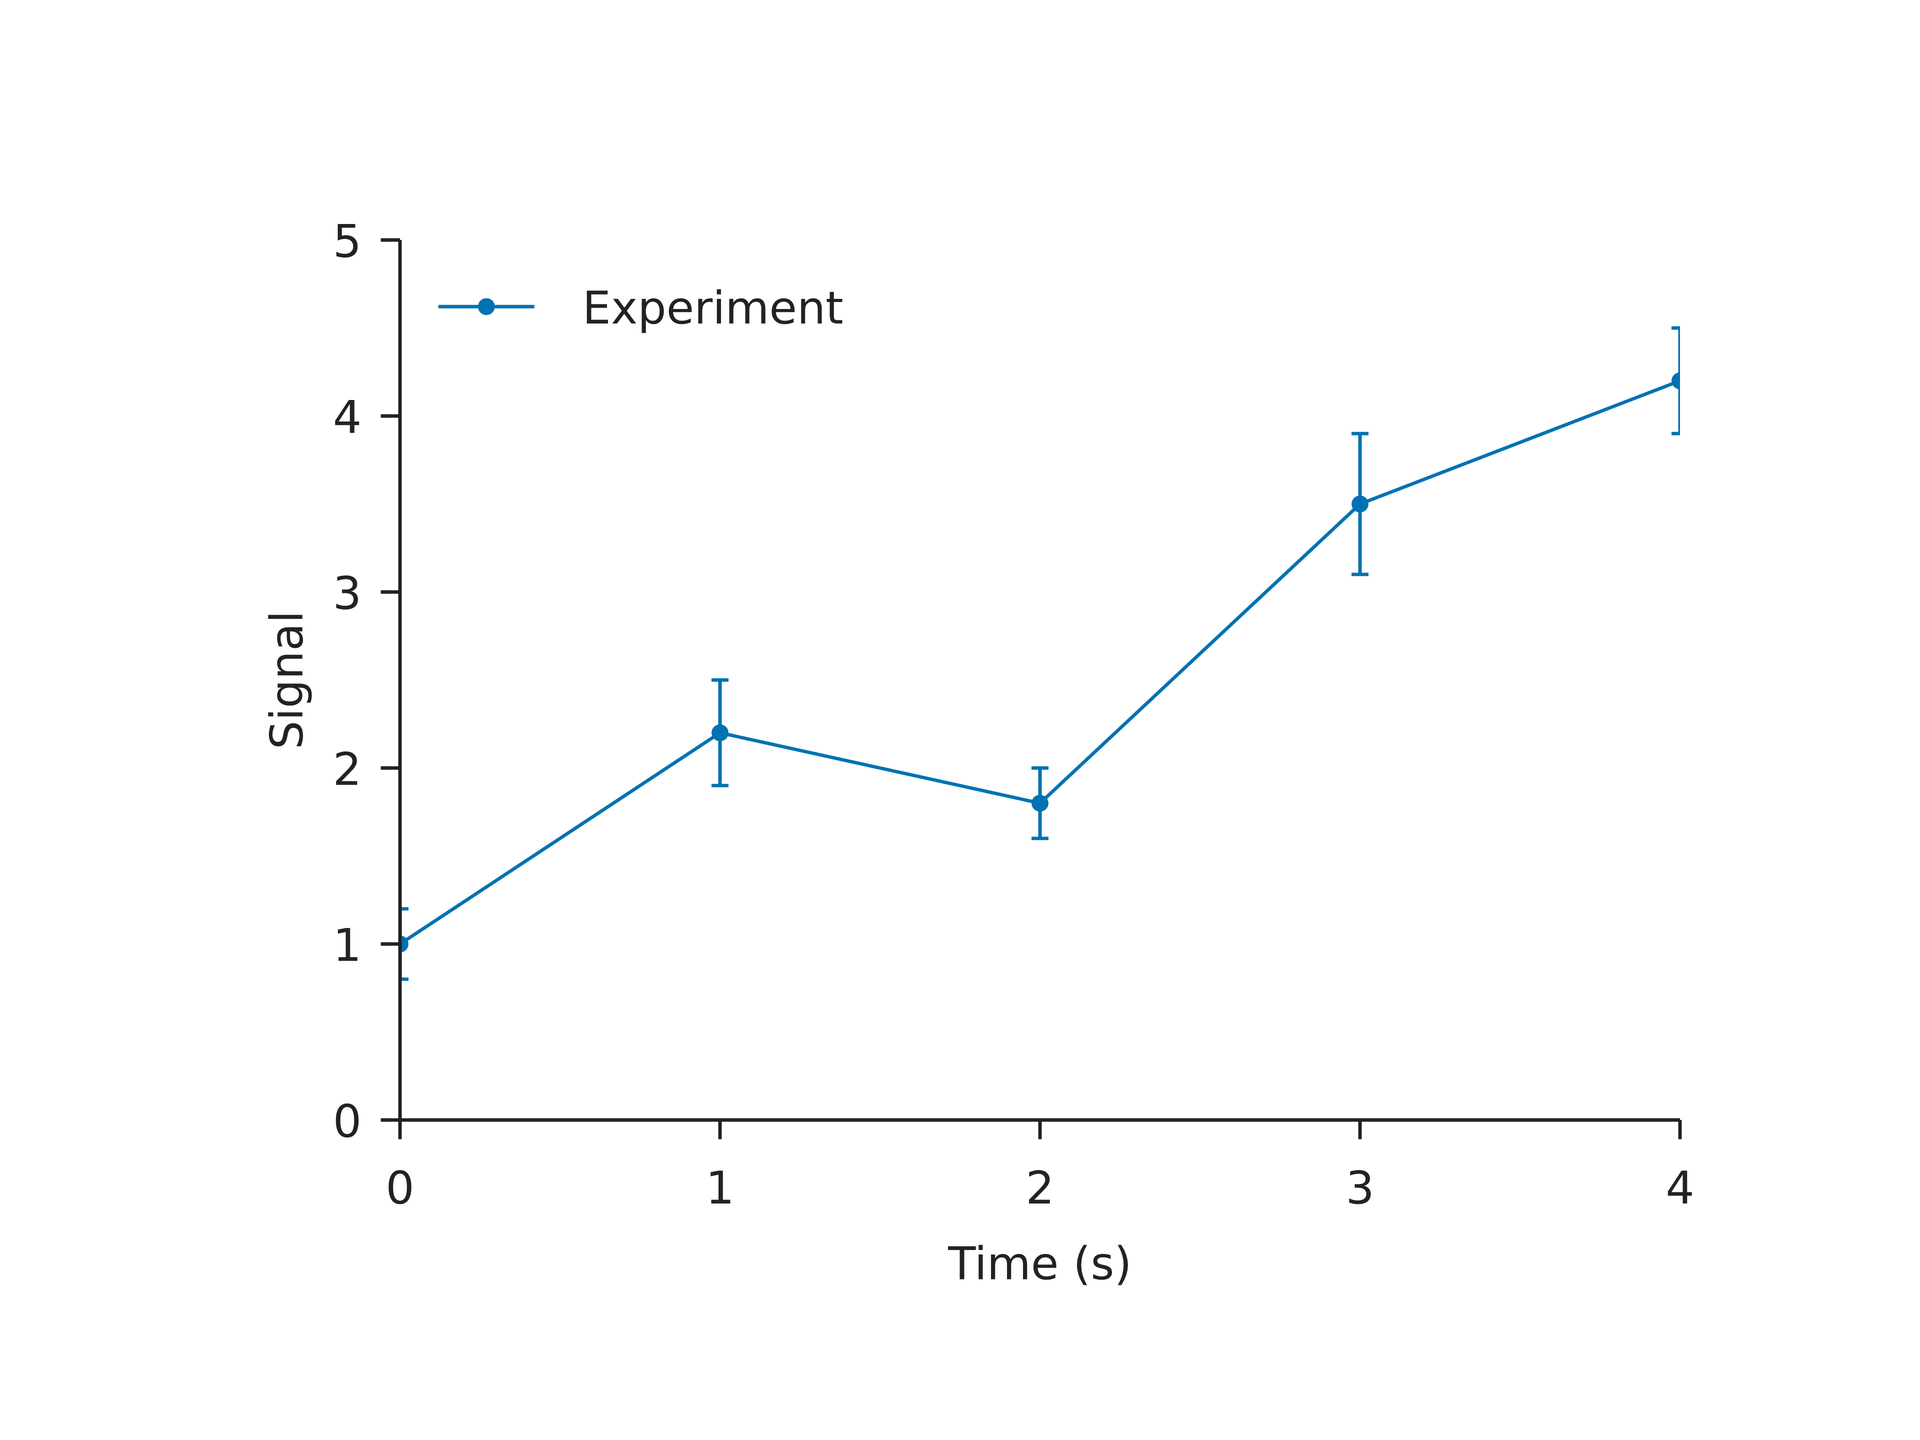
Replace inline x/y lists with table columns for experimental data. Explicit axis ranges aid comparisons; plot_area keeps equal physical data regions.
page = canvas(size=(120 mm, 90 mm), background="#ffffff")d = table(src="first-plot.csv")s = plot_style(font_family="DejaVu Sans", font_size=8 pt)p = plot(size=(110 mm, 80 mm), plot_area=box(offset=(20 mm, 10 mm), size=(80 mm, 55 mm)), x=axis(label="Time (s)", range=(0, 4)), y=axis(label="Signal", range=(0, 5)), style=s)p.line(x=d["time"], y=d["signal"], marker= circle, color="#0072B2", label="Experiment")p.errorbar(x=d["time"], y=d["signal"], yerr=d["error"], color="#0072B2")p.legend(position= top_left)chart = page.add(p, offset=(5 mm, 5 mm))page = canvas(size=(120 mm, 90 mm), background="#ffffff")d = table(src="first-plot.csv")s = plot_style(font_family="DejaVu Sans", font_size=8 pt)p = plot(size=(110 mm, 80 mm), plot_area=box(offset=(20 mm, 10 mm), size=(80 mm, 55 mm)), x=axis(label="Time (s)", range=(0, 4)), y=axis(label="Signal", range=(0, 5)), style=s)p.line(x=d["time"], y=d["signal"], marker= circle, color="#0072B2", label="Experiment")p.errorbar(x=d["time"], y=d["signal"], yerr=d["error"], color="#0072B2")p.legend(position= top_left)chart = page.add(p, offset=(5 mm, 5 mm))time,signal,error0,1.0,0.21,2.2,0.32,1.8,0.23,3.5,0.44,4.2,0.3Preview
Dependencies
examples/plot/first-plot.csvexamples/plot/first-plot.lay
Common errors and limits#
A chart is sealed after its first placement. x/y lengths must match. Do not add mm to data values: physical styles and data units serve different purposes.
Individual functions#
Detailed behavior and further examples#
Parameters#
| Parameter | Purpose | Default or requirement |
|---|---|---|
plot_area |
Fixed data area | Example: (20,10,80,55) mm |
src |
CSV path | Relative to defining file |
Data and fixed plot area#
The example reads first-plot.csv beside the source. Switch to the CSV tab to read all data; preserve relative font and CSV locations.
The canvas is 120 × 90 mm. The chart is placed at (5,5) mm and its internal data area starts at (20,10) mm, giving a page position of (25,15) mm and a size of 80 × 55 mm. Changing labels or moving the legend does not change that area; insufficient space produces a warning. Finish layers and decorations before page.add.
Compare plot_area and page_transform in the inspection JSON against those dimensions. At 300 DPI the PNG should measure 1417 × 1063 px.
Export and inspect#
laymesh validate examples/plot/first-plot.laylaymesh render examples/plot/first-plot.lay -o first-plot.svglaymesh render examples/plot/first-plot.lay -o first-plot.pdflaymesh render examples/plot/first-plot.lay -o first-plot.png --dpi 300laymesh inspect examples/plot/first-plot.lay --json