 LayMesh
Colormap presets#
Purpose and concepts#
cmap is an immutable named colormap; palette returns a color list for loops or plot_style. Presets use Matplotlib 3.11.2 native LUTs without a runtime Matplotlib dependency.
Minimal complete example#
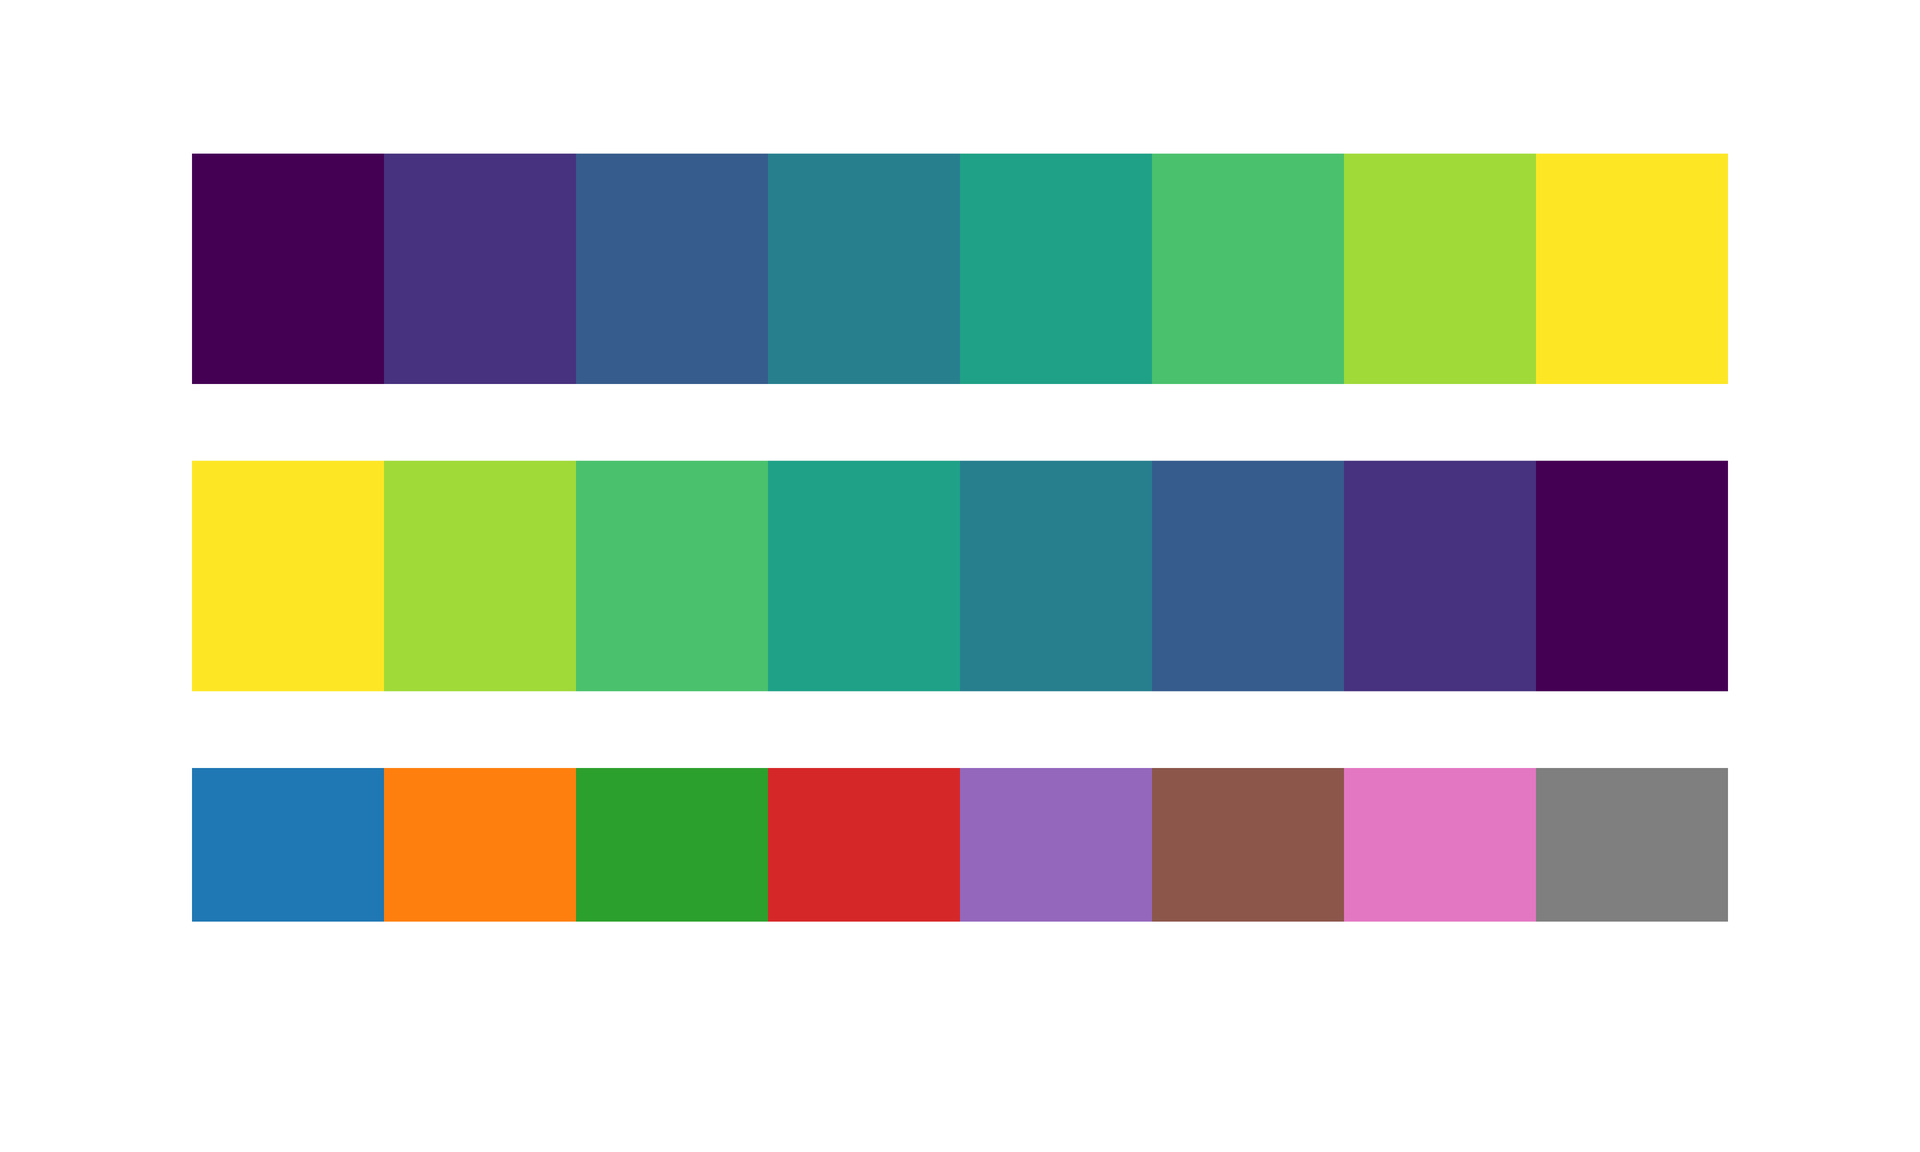
Run this file directly with laymesh validate or laymesh render; it contains its own canvas and required definitions.
# Preset discovery, sampling, colors and immutable reversal.page=canvas(size=(100mm,60mm),background="#ffffff")cm=cmap("viridis")names=cmap_names(category="sequential")colors=cm.colors(8)reverse=cm.reversed()accent=cm.sample(0.5)cycle=palette("tab10",8)for i,color in enumerate(colors) { page.add(rect(size=(10mm,12mm),fill=color),offset=(10mm+i*10mm,8mm)) page.add(rect(size=(10mm,12mm),fill=reverse.sample(i/7)),offset=(10mm+i*10mm,24mm)) page.add(rect(size=(10mm,8mm),fill=cycle[i]),offset=(10mm+i*10mm,40mm))}# Preset discovery, sampling, colors and immutable reversal.page=canvas(size=(100mm,60mm),background="#ffffff")cm=cmap("viridis")names=cmap_names(category="sequential")colors=cm.colors(8)reverse=cm.reversed()accent=cm.sample(0.5)cycle=palette("tab10",8)for i,color in enumerate(colors) { page.add(rect(size=(10mm,12mm),fill=color),offset=(10mm+i*10mm,8mm)) page.add(rect(size=(10mm,12mm),fill=reverse.sample(i/7)),offset=(10mm+i*10mm,24mm)) page.add(rect(size=(10mm,8mm),fill=cycle[i]),offset=(10mm+i*10mm,40mm))}Preview
Dependencies
examples/manual/cmaps.lay
Parameters and default behavior#
Unitless geometry uses the canvas unit; unitless type and stroke sizes use pt. Explicit call parameters override inherited/theme defaults. The linked interface reference lists accepted types, choices and defaults per parameter.
Composition#
Iterate over cmap_names() to explore every preset. Categorical colors retain native order, sequential maps sample evenly and cyclic maps omit the repeated endpoint. Shared color_scale keeps layers and colorbars consistent.
# Preset discovery, sampling, colors and immutable reversal.page=canvas(size=(100mm,60mm),background="#ffffff")cm=cmap("viridis")names=cmap_names(category="sequential")colors=cm.colors(8)reverse=cm.reversed()accent=cm.sample(0.5)cycle=palette("tab10",8)for i,color in enumerate(colors) { page.add(rect(size=(10mm,12mm),fill=color),offset=(10mm+i*10mm,8mm)) page.add(rect(size=(10mm,12mm),fill=reverse.sample(i/7)),offset=(10mm+i*10mm,24mm)) page.add(rect(size=(10mm,8mm),fill=cycle[i]),offset=(10mm+i*10mm,40mm))}# Preset discovery, sampling, colors and immutable reversal.page=canvas(size=(100mm,60mm),background="#ffffff")cm=cmap("viridis")names=cmap_names(category="sequential")colors=cm.colors(8)reverse=cm.reversed()accent=cm.sample(0.5)cycle=palette("tab10",8)for i,color in enumerate(colors) { page.add(rect(size=(10mm,12mm),fill=color),offset=(10mm+i*10mm,8mm)) page.add(rect(size=(10mm,12mm),fill=reverse.sample(i/7)),offset=(10mm+i*10mm,24mm)) page.add(rect(size=(10mm,8mm),fill=cycle[i]),offset=(10mm+i*10mm,40mm))}Preview
Dependencies
examples/manual/cmaps.lay
Common errors and limits#
Names are case-sensitive and support native aliases and _r; rdbu aliases RdBu. n is an integer from 0 to 10,000; t must be finite and is clamped outside the domain. Existing names now use Matplotlib colors, changing some previous output.
Individual functions#
cmap#
Get an immutable named Matplotlib 3.11.2 colormap for sampling, palette lists and reversal.
Returns: cmap
Minimal complete source · Composition source · All parameters
cmap_names#
List canonical colormap names, optionally filtered by category and including reversed names; aliases are omitted.
Returns: list
Minimal complete source · Composition source · All parameters
palette#
Create a palette: categorical colors cycle in native order, sequential colors sample evenly, and cyclic maps omit the repeated endpoint.
Returns: list
Minimal complete source · Composition source · All parameters
cmap-sample#
Sample a finite normalized position, clamping values outside zero to one.
Returns: color
Required inputs: t.
Minimal complete source · Composition source · All parameters
cmap-colors#
Return a palette with native size by default; categorical colors cycle, sequential maps sample evenly and cyclic maps omit the repeated endpoint.
Returns: list
Minimal complete source · Composition source · All parameters
cmap-reversed#
Return a reversed colormap using Matplotlib native reversed lookup tables.
Returns: cmap
Minimal complete source · Composition source · All parameters
Detailed behavior and further examples#
Names are case-sensitive. Native Matplotlib aliases and _r names are accepted; rdbu aliases RdBu. cmap_names() lists 87 canonical presets; reversed=true lists 174 canonical names. All registered upstream aliases remain usable.
cmap("viridis") returns an immutable handle; .sample(t) clamps finite positions to 0–1, .colors(n) returns typed colors, and .reversed() creates an independent reversed handle. palette("tab10") is a shortcut for cmap("tab10").colors().
Sequential and diverging palettes use evenly spaced positions, with one sample at the midpoint. Cyclic palettes sample [0, 1) to avoid a repeated endpoint. Qualitative palettes select original colors in order and wrap when n exceeds their size. Omitted/null n uses the native LUT size; n=0 is empty, and integers outside 0–10,000 are rejected.
cm = cmap("coolwarm")scale = color_scale(norm="centered", vmin=-2, vmax=2, center=0, cmap=cm)style = plot_style(colors=palette("tab10"))The same color_scale can be shared by heatmap, contourf, numeric scatter and colorbar. Custom color lists retain RGB/alpha interpolation. Explicit layer colors override the style cycle.
Dictionary series · Shared scale · Full catalogue
Preset catalogue#
| Category | Presets |
|---|---|
sequential |
magma, inferno, plasma, viridis, cividis, Blues, BuGn, BuPu, GnBu, Greens, Greys, OrRd, Oranges, PuBu, PuBuGn, PuRd, Purples, RdPu, Reds, Wistia, YlGn, YlGnBu, YlOrBr, YlOrRd, afmhot, autumn, bone, cool, copper, gist_heat, gray, hot, pink, spring, summer, winter |
diverging |
berlin, managua, vanimo, BrBG, PRGn, PiYG, PuOr, RdBu, RdGy, RdYlBu, RdYlGn, Spectral, bwr, coolwarm, seismic |
cyclic |
twilight, twilight_shifted, hsv |
qualitative |
Accent, okabe_ito, Dark2, Paired, Pastel1, Pastel2, Set1, Set2, Set3, tab10, tab20, tab20b, tab20c |
misc |
turbo, CMRmap, binary, brg, cubehelix, flag, gist_earth, gist_gray, gist_ncar, gist_rainbow, gist_stern, gist_yarg, gnuplot, gnuplot2, jet, nipy_spectral, ocean, prism, rainbow, terrain |
Compatibility and reproduction#
Colors now follow Matplotlib 3.11.2, including native reversed LUTs and 8-bit RGB quantization. Older cividis/RdBu output can change. Data and source hashes are committed; ordinary native/WASM builds do not require Python or Matplotlib. To regenerate or verify, install the optional release/cmap-requirements.txt and run python scripts/build-cmaps.py or append --check. Source attribution and the Matplotlib license are included in release notices.