 LayMesh
Plot Hist
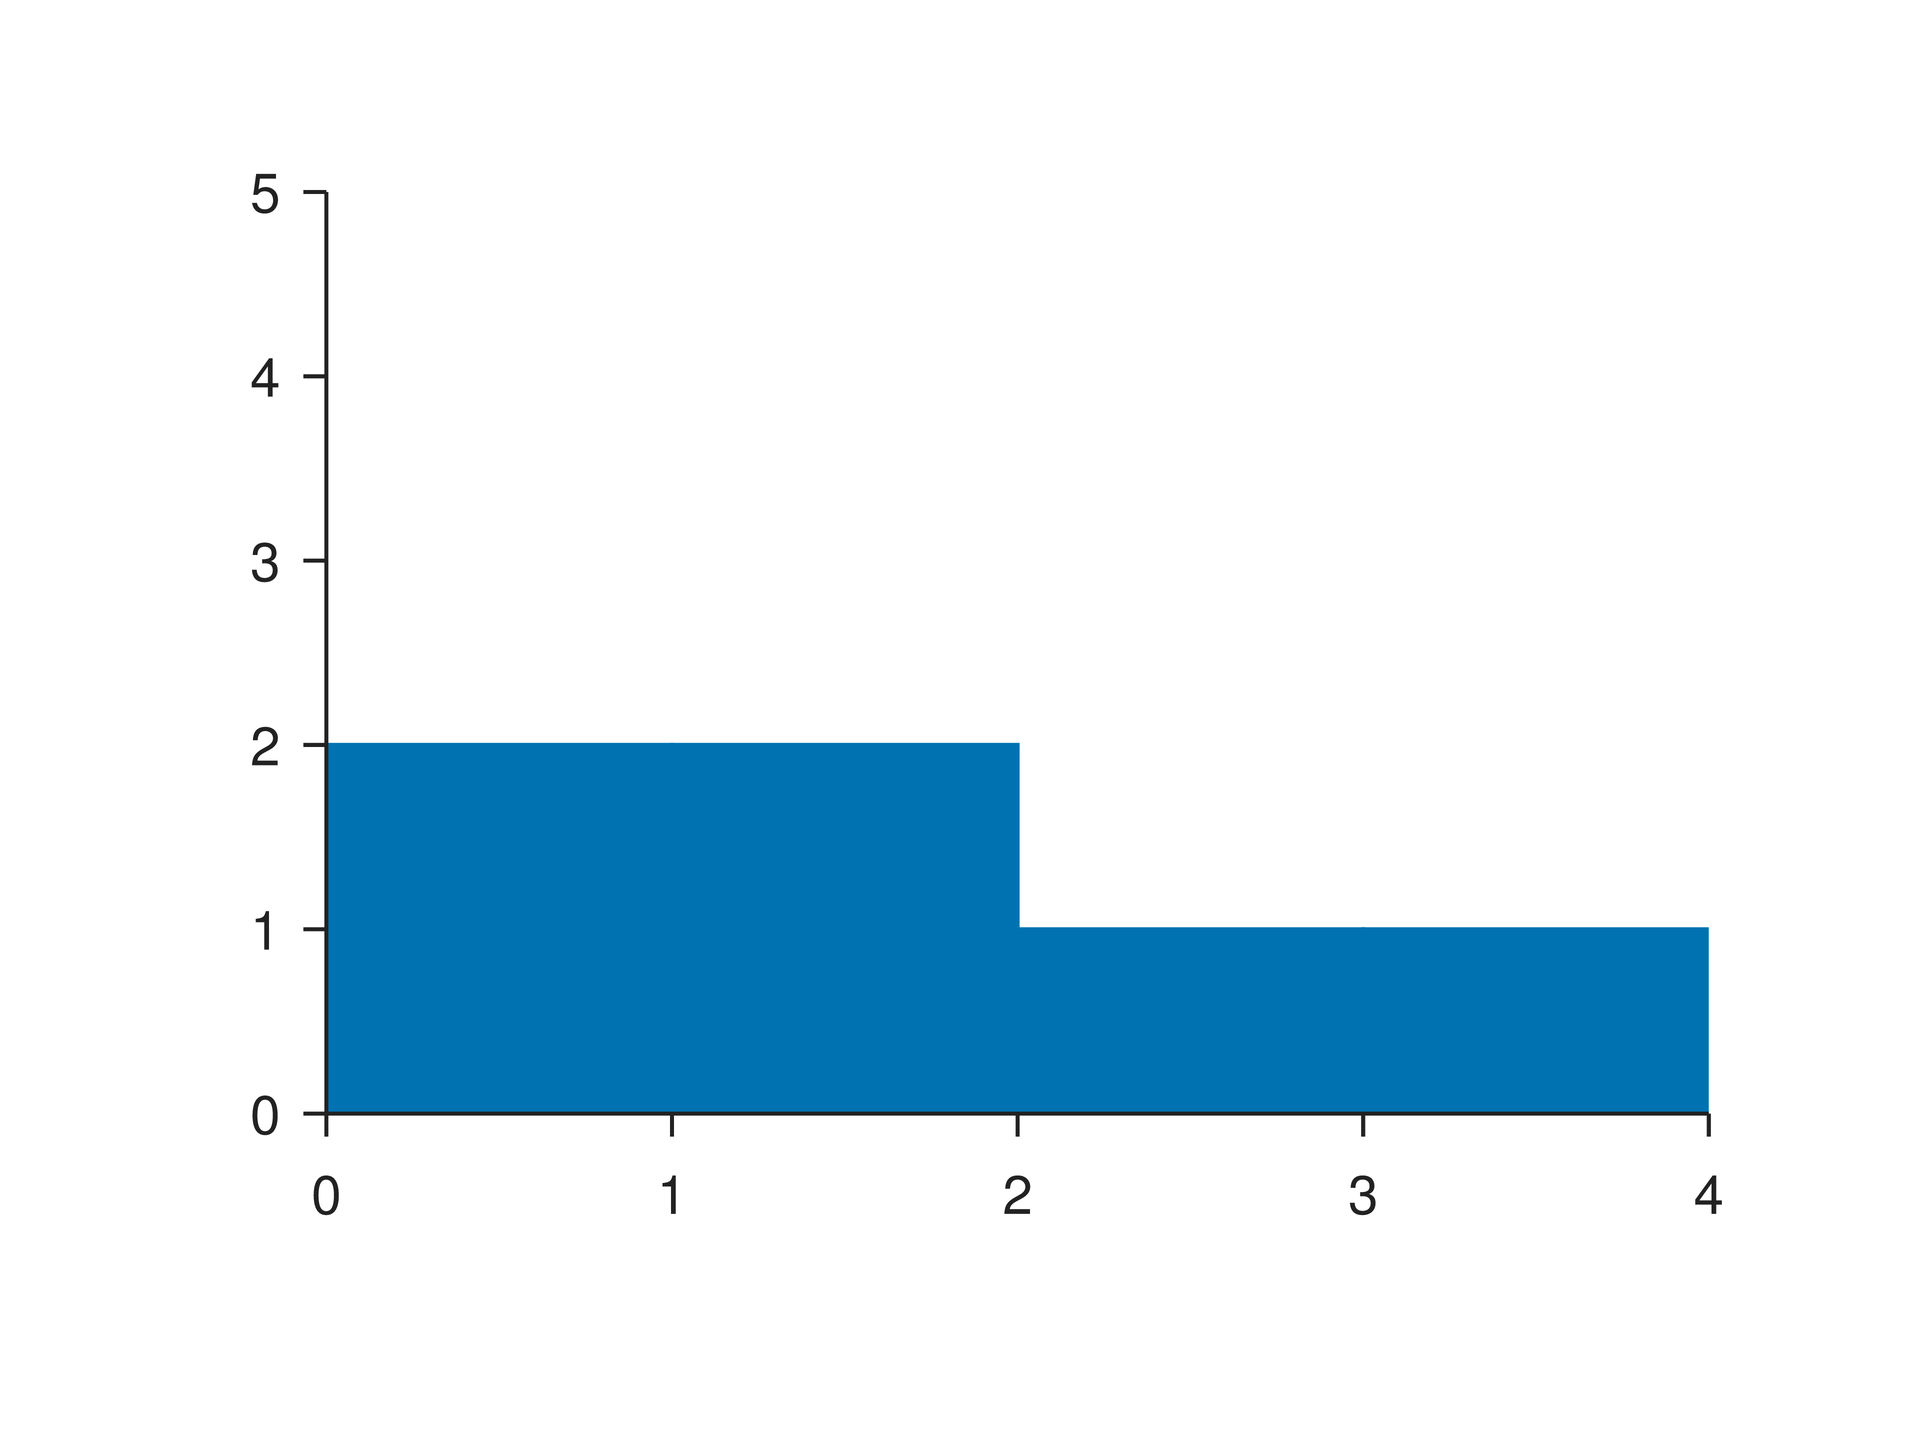
# Minimal complete example: plot.histpage=canvas(size=(100mm,75mm),background="#ffffff")p=plot(size=(86mm,62mm),x=axis(range=(0,4)),y=axis(range=(0,5)))p.hist(values=[0.2,0.8,1.1,1.2,2.4,3.1],bins=[0,1,2,3,4])page.add(p,offset=(7mm,6mm))# Minimal complete example: plot.histpage=canvas(size=(100mm,75mm),background="#ffffff")p=plot(size=(86mm,62mm),x=axis(range=(0,4)),y=axis(range=(0,5)))p.hist(values=[0.2,0.8,1.1,1.2,2.4,3.1],bins=[0,1,2,3,4])page.add(p,offset=(7mm,6mm))Preview
Background
Dependencies
examples/manual/plot-hist.lay
Reproduce
laymesh validate examples/manual/plot-hist.laylaymesh render examples/manual/plot-hist.lay -o figure.svglaymesh render examples/manual/plot-hist.lay -o figure.pdflaymesh render examples/manual/plot-hist.lay -o figure.png --dpi 300