 LayMesh
Polar layers#
Purpose and concepts#
Polar layers reuse line, scatter, errors, bars and field APIs, with x/y interpreted as theta/r. Error and bar widths use angular/radial data units; stroke widths remain physical.
Minimal complete example#
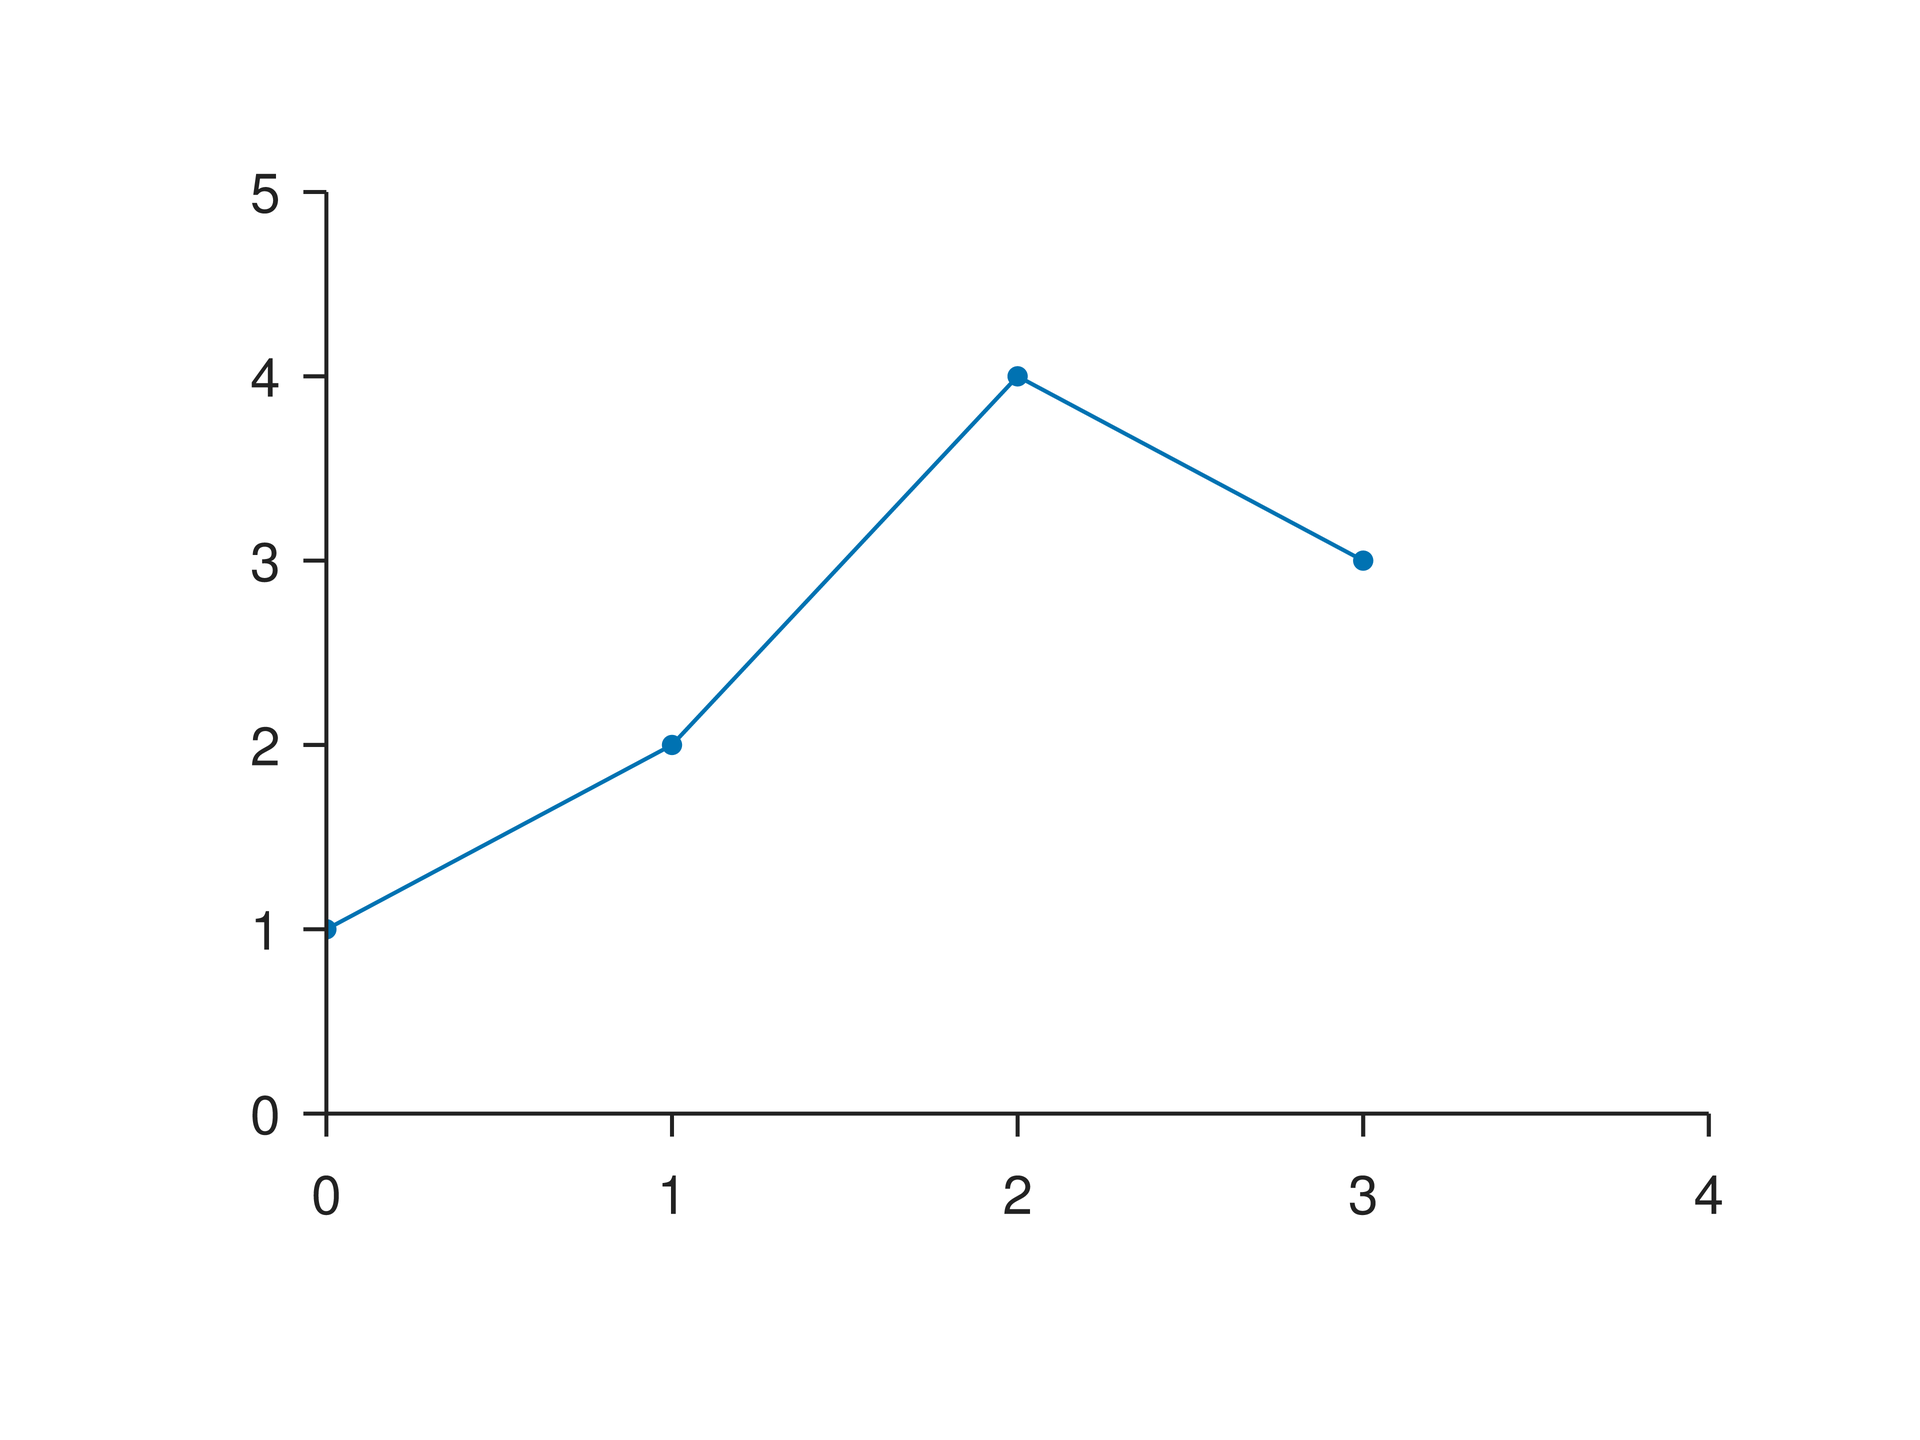
Run this file directly with laymesh validate or laymesh render; it contains its own canvas and required definitions.
# Minimal complete example: plot.linepage=canvas(size=(100mm,75mm),background="#ffffff")p=plot(size=(86mm,62mm),x=axis(range=(0,4)),y=axis(range=(0,5)))p.line(x=[0,1,2,3],y=[1,2,4,3],marker=circle)page.add(p,offset=(7mm,6mm))# Minimal complete example: plot.linepage=canvas(size=(100mm,75mm),background="#ffffff")p=plot(size=(86mm,62mm),x=axis(range=(0,4)),y=axis(range=(0,5)))p.line(x=[0,1,2,3],y=[1,2,4,3],marker=circle)page.add(p,offset=(7mm,6mm))Preview
Dependencies
examples/manual/plot-line.lay
Parameters and default behavior#
Unitless geometry uses the canvas unit; unitless type and stroke sizes use pt. Explicit call parameters override inherited/theme defaults. The linked interface reference lists accepted types, choices and defaults per parameter.
Composition#
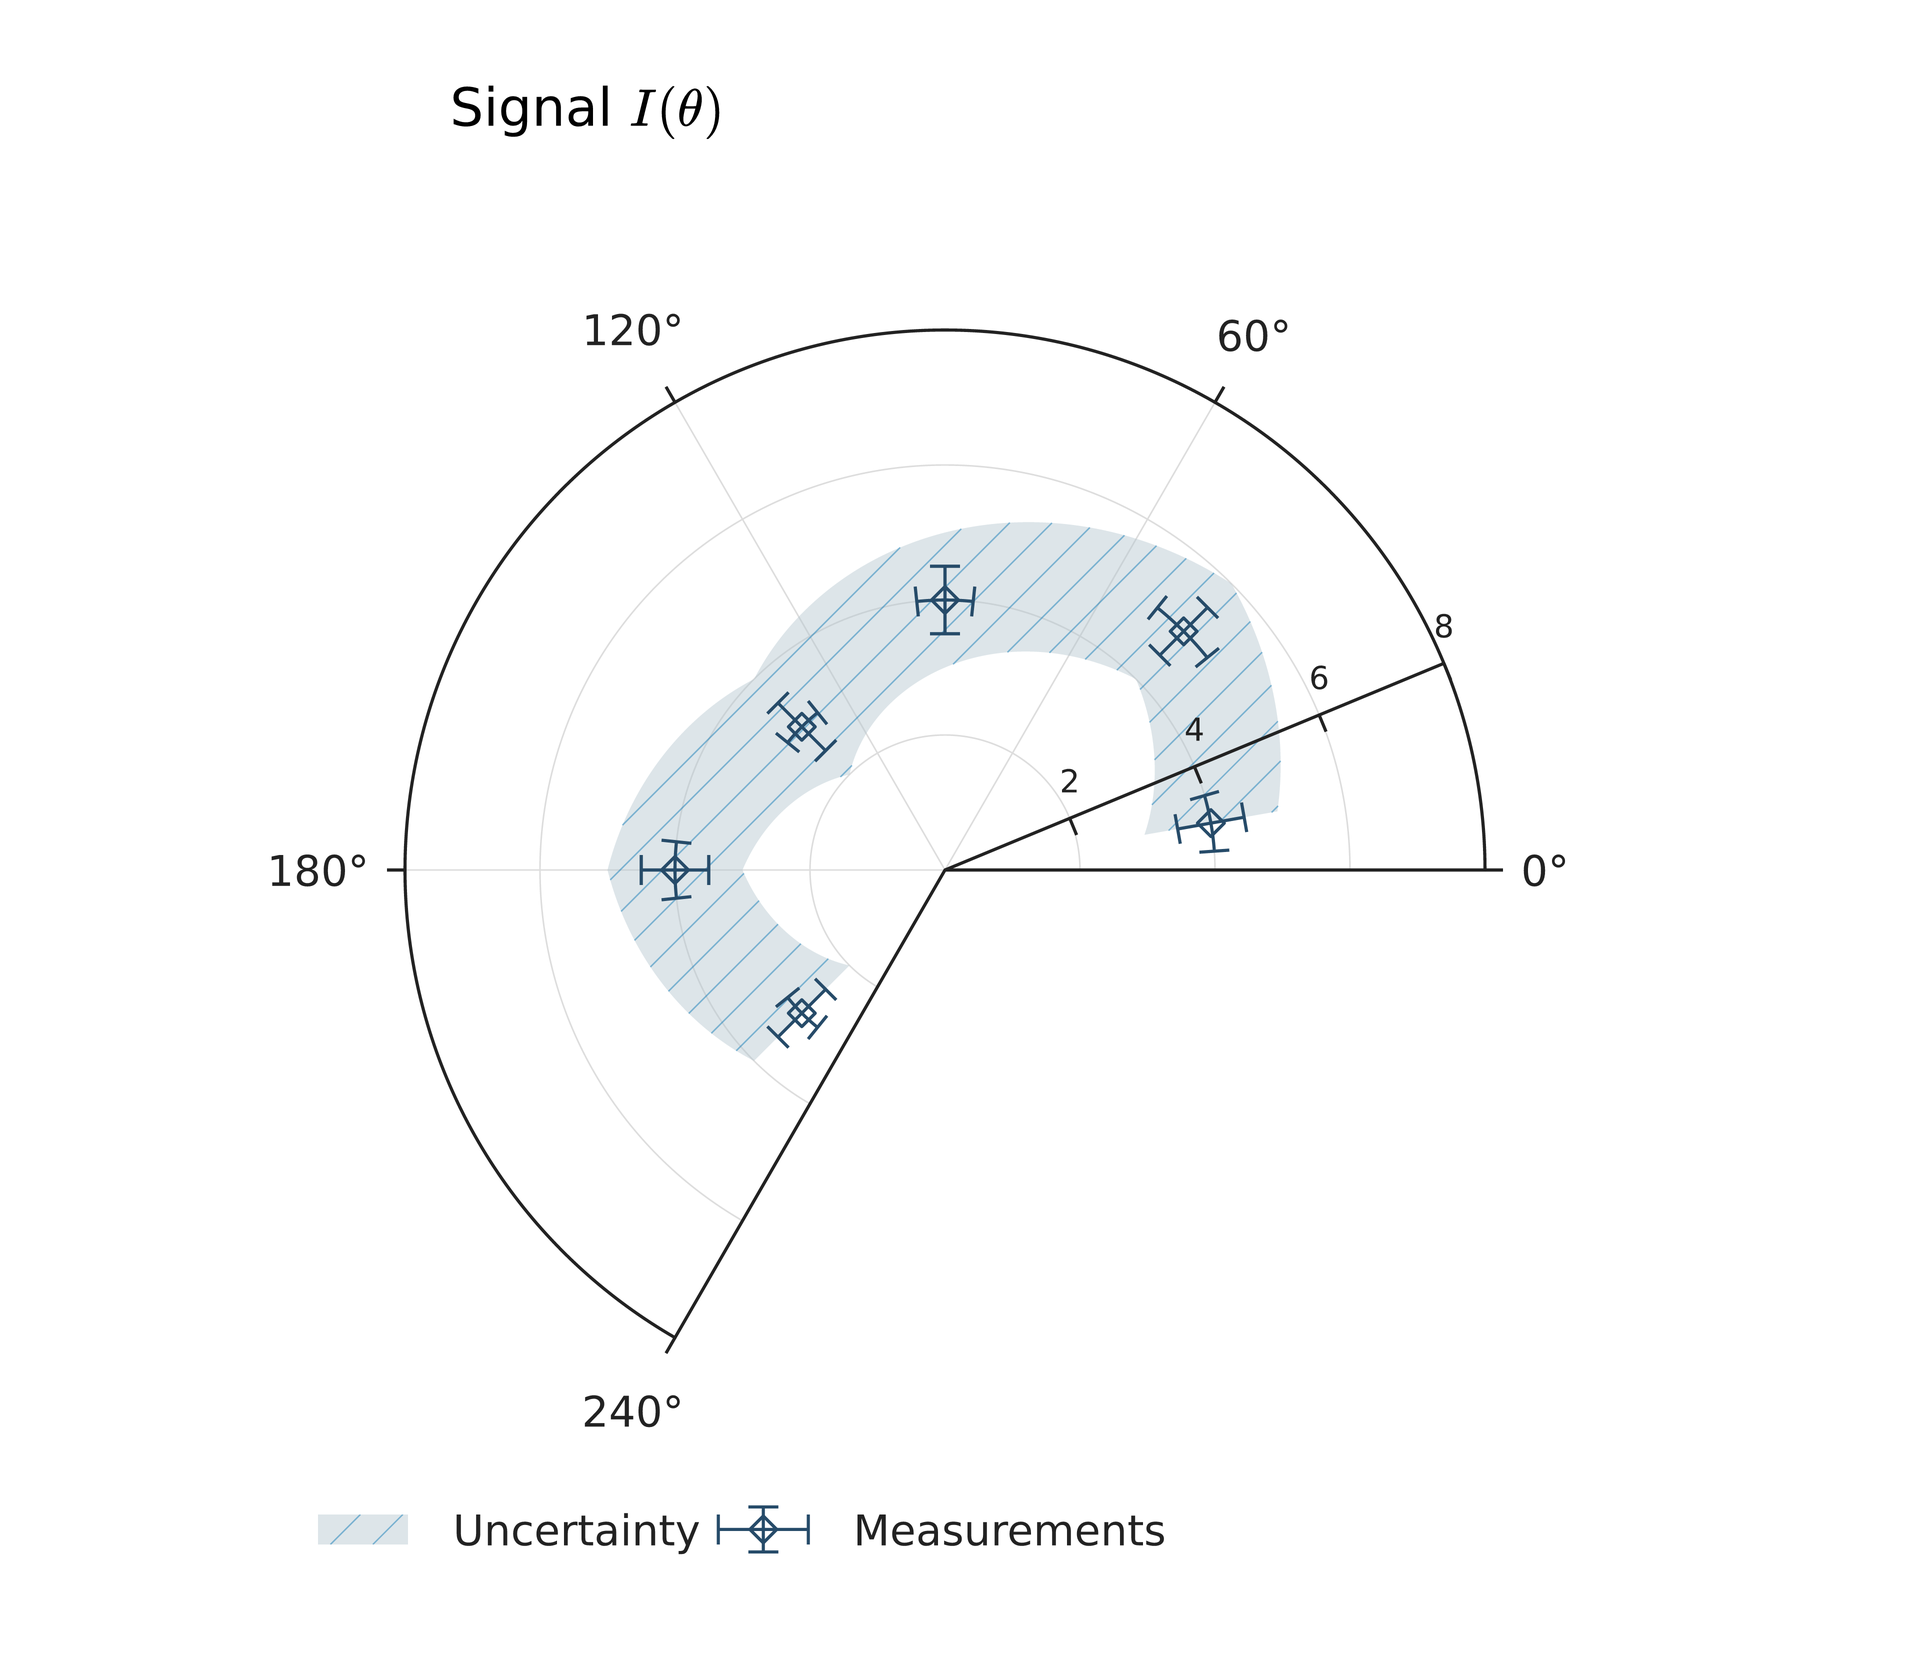
Compare polar interpolation and chord lines on one page, then add angular/radial errors. Sector cells and contours can share a color scale.
page=canvas(size=(128 mm,112 mm),background="#ffffff")s=plot_style(font_family="DejaVu Sans",font_size=8 pt)p=plot(projection= polar,size=(118 mm,100 mm),plot_area=box(offset=(23 mm, 20 mm), size=(72 mm, 72 mm)),style=s, theta=axis(range=(0,240),ticks=[0,60,120,180,240],grid= major),r=axis(range=(0,8),ticks=[2,4,6,8],grid= major,tick_font_size=6 pt))b=p.band(theta=[10,45,90,135,180,225],lower=[3,4,3,2,3,2],upper=[5,6,5,4,5,4],fill="#b3c5ce",hatch="slash",hatch_spacing=2 mm,hatch_width=0.1 mm,opacity=0.45,label="Uncertainty")e=p.errorbar(theta=[10,45,90,135,180,225],r=[4,5,4,3,4,3],thetaerr=6,rerr=0.5,marker= diamond,marker_size=2 mm,marker_fill="none",marker_border_color="#264b69",color="#264b69",cap_size=2 mm,label="Measurements")c=page.add(p,offset=(4 mm,2 mm))page.add(text(spans=[span("Signal "),formula(source=r"I(\theta)",font_size=10 pt)],font_family="DejaVu Sans",font_size=10 pt),offset=(30 mm,5 mm))page.add(legend(layers=[b,e],columns=2,style=s),offset=(20 mm,99 mm))# BEGIN DEMOpage=canvas(size=(128 mm,112 mm),background="#ffffff")s=plot_style(font_family="DejaVu Sans",font_size=8 pt)p=plot(projection= polar,size=(118 mm,100 mm),plot_area=box(offset=(23 mm, 20 mm), size=(72 mm, 72 mm)),style=s, theta=axis(range=(0,240),ticks=[0,60,120,180,240],grid= major),r=axis(range=(0,8),ticks=[2,4,6,8],grid= major,tick_font_size=6 pt))b=p.band(theta=[10,45,90,135,180,225],lower=[3,4,3,2,3,2],upper=[5,6,5,4,5,4],fill="#b3c5ce",hatch="slash",hatch_spacing=2 mm,hatch_width=0.1 mm,opacity=0.45,label="Uncertainty")e=p.errorbar(theta=[10,45,90,135,180,225],r=[4,5,4,3,4,3],thetaerr=6,rerr=0.5,marker= diamond,marker_size=2 mm,marker_fill="none",marker_border_color="#264b69",color="#264b69",cap_size=2 mm,label="Measurements")c=page.add(p,offset=(4 mm,2 mm))page.add(text(spans=[span("Signal "),formula(source=r"I(\theta)",font_size=10 pt)],font_family="DejaVu Sans",font_size=10 pt),offset=(30 mm,5 mm))page.add(legend(layers=[b,e],columns=2,style=s),offset=(20 mm,99 mm))# END DEMOPreview
Dependencies
examples/plot/polar-errors.lay
Common errors and limits#
Projection handles visibility on original geometry; zero crossings and missing points can split paths. Do not use length units in angular data arrays; angle-configuration parameters support angle-unit syntax.
Individual functions#
Detailed behavior and further examples#
Parameters#
| Parameter | Purpose | Default or requirement |
|---|---|---|
theta / r |
Angular and radial data | Matching sequence lengths |
plot_area |
Physical plot area | Does not shrink when explicitly fixed |
Common usage#
| Method | Polar parameters |
|---|---|
line/scatter/step |
theta/r; step retains pre/mid/post; scatter supports per-point color, physical size and opacity |
errorbar |
theta/r with thetaerr/rerr; scalar, per-point or asymmetric two-row errors; angular errors are arcs |
area/band |
theta/r/baseline or theta/lower/upper; baselines can be arrays |
bar |
positions/values/width/baseline; angle positions/width, signed radial increments; default width 20° or its radian equivalent |
hist |
values/bins/weights/stat; wrap angles into one turn, default 10 bins over the current angular range |
heatmap |
Required z/theta_edges/r_edges; rows are radial, columns angular; cells are annular sectors |
contour/contourf |
Required z/theta/r/levels; increasing, optionally nonuniform grids; compute in original grid units then project |
Histogram probability uses included total weight; density also divides by bin width in the chosen angle unit. Radial height represents the statistic directly, without square-root area normalization. Observations outside a partial sector are excluded with a warning.
Contours use periodic=true explicitly for full-circle grids, with increasing theta samples that do not repeat the endpoint. The last sample connects to the first. Default false does not infer periodicity. Cells adjacent to missing samples remain empty. Seam handling does not accumulate fill opacity. Negative radial grids use the same half-turn reflection.
Field source · Errors and hatching · Angular histogram and stacking. Reuse existing color scales, local/standalone legends and colorbars, and physical hatches. Local colorbars follow the data rectangle sides; overlap warns without moving anything.
Polar plots currently have one angular and one radial axis. Additional axes, breaks, and polar box/violin layers are rejected explicitly.