 LayMesh
极坐标图层#
用途与概念#
极坐标图层沿用折线、散点、误差、柱图与场图 API,x/y 对应 theta/r。误差和柱宽仍以角度或半径数据单位解释,描边宽度仍是物理尺寸。
最小完整示例#
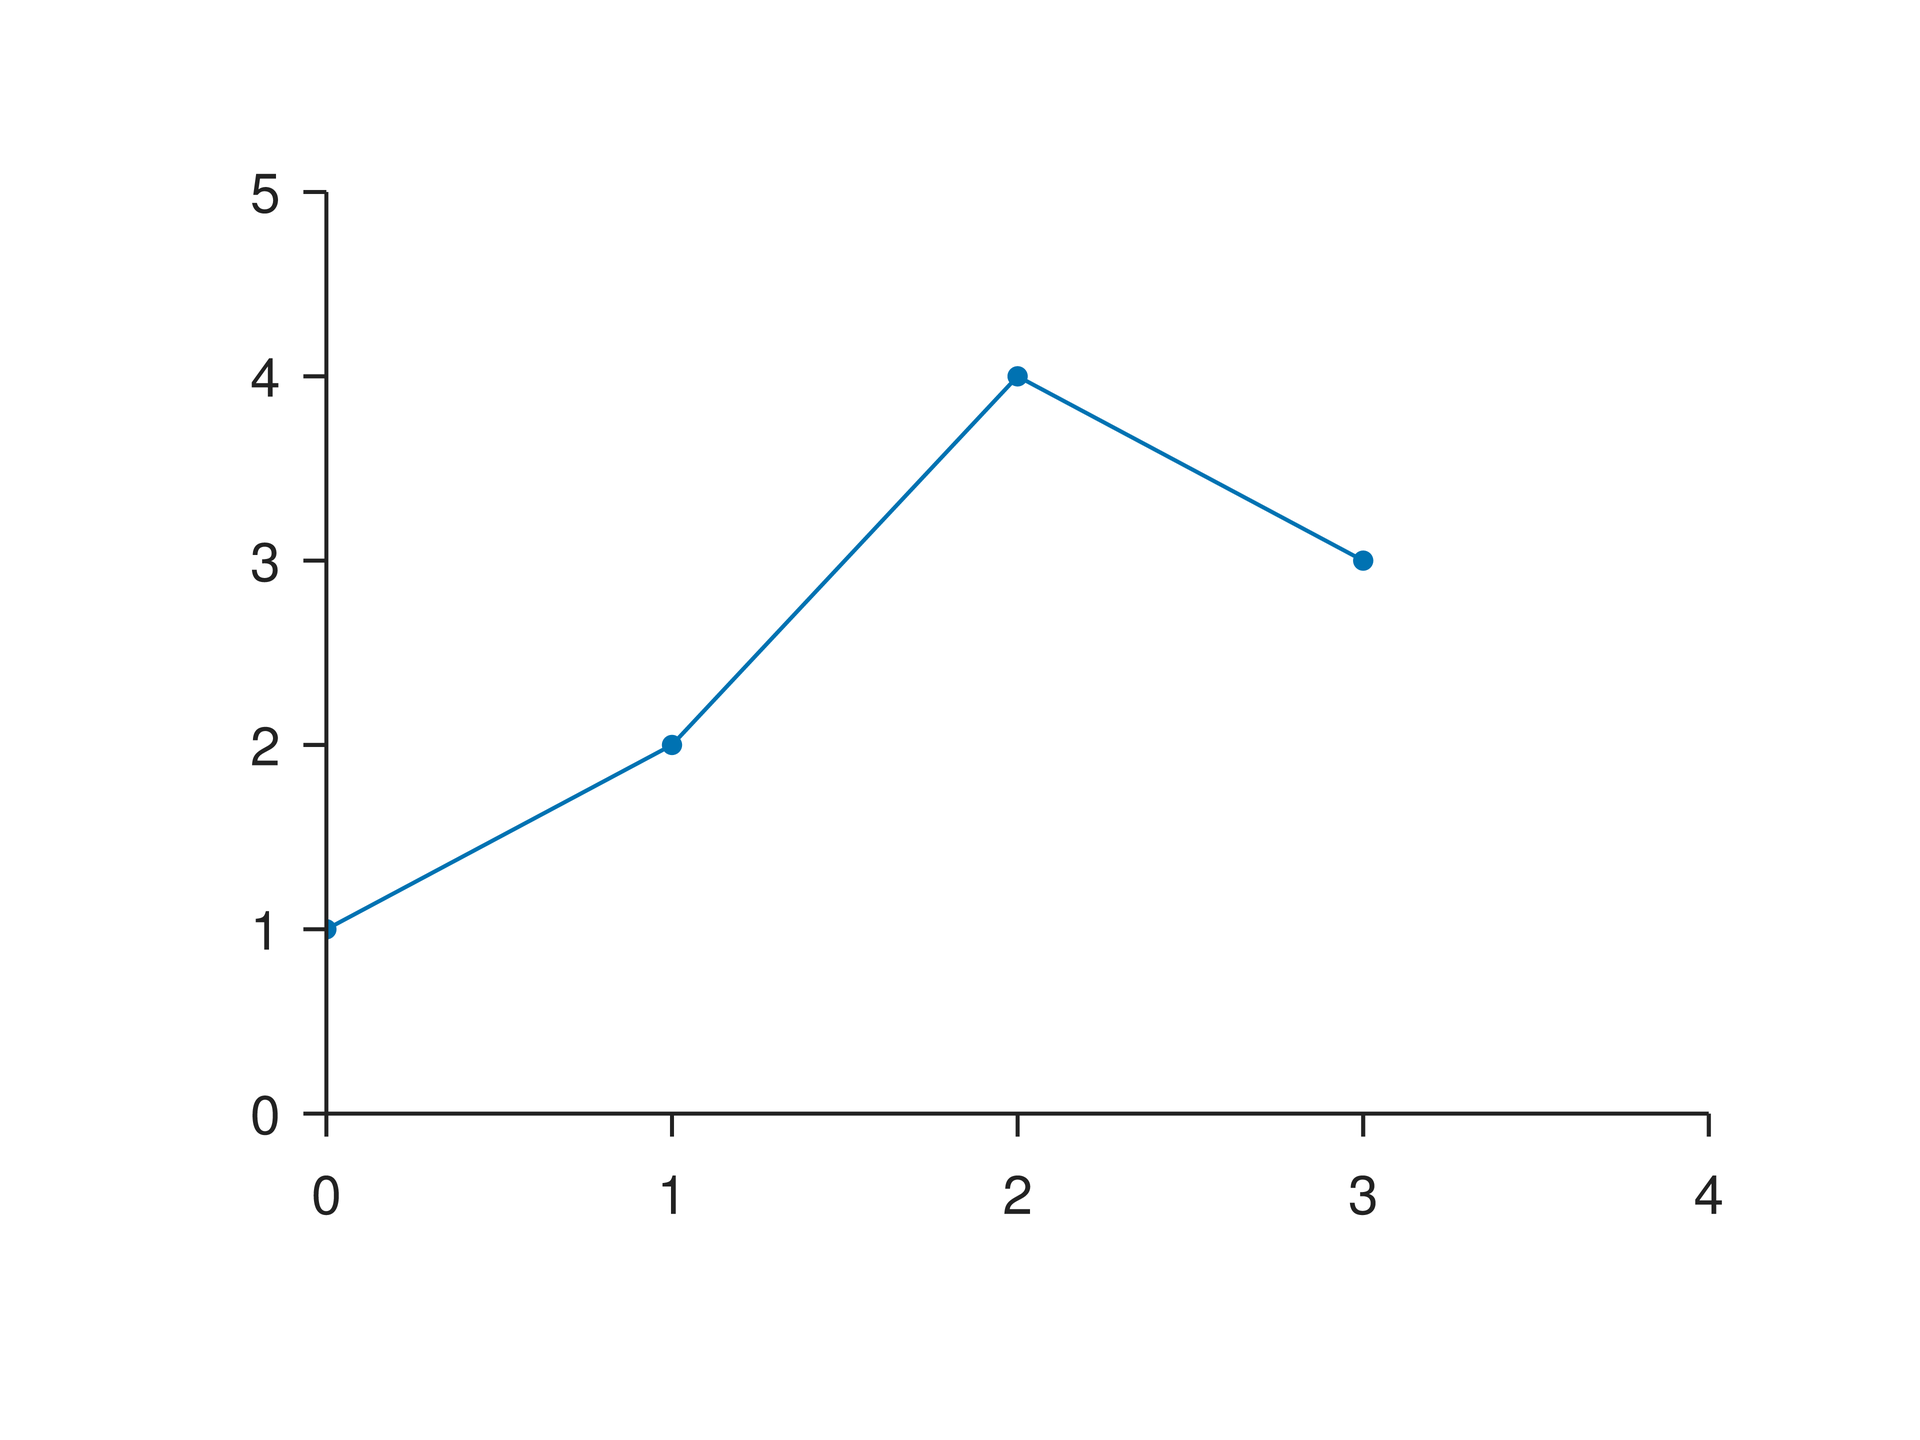
此文件包含画布及必要定义,可直接运行 laymesh validate 或 laymesh render,不依赖前文未声明的变量。
# Minimal complete example: plot.linepage=canvas(size=(100mm,75mm),background="#ffffff")p=plot(size=(86mm,62mm),x=axis(range=(0,4)),y=axis(range=(0,5)))p.line(x=[0,1,2,3],y=[1,2,4,3],marker=circle)page.add(p,offset=(7mm,6mm))# Minimal complete example: plot.linepage=canvas(size=(100mm,75mm),background="#ffffff")p=plot(size=(86mm,62mm),x=axis(range=(0,4)),y=axis(range=(0,5)))p.line(x=[0,1,2,3],y=[1,2,4,3],marker=circle)page.add(p,offset=(7mm,6mm))预览
背景
依赖文件
examples/manual/plot-line.lay
参数与默认行为#
裸几何长度使用画布单位,裸字号和描边宽度使用 pt。显式调用参数优先于继承和主题默认值;下面的接口参考逐项列出允许类型、可选值与默认来源。
组合用法#
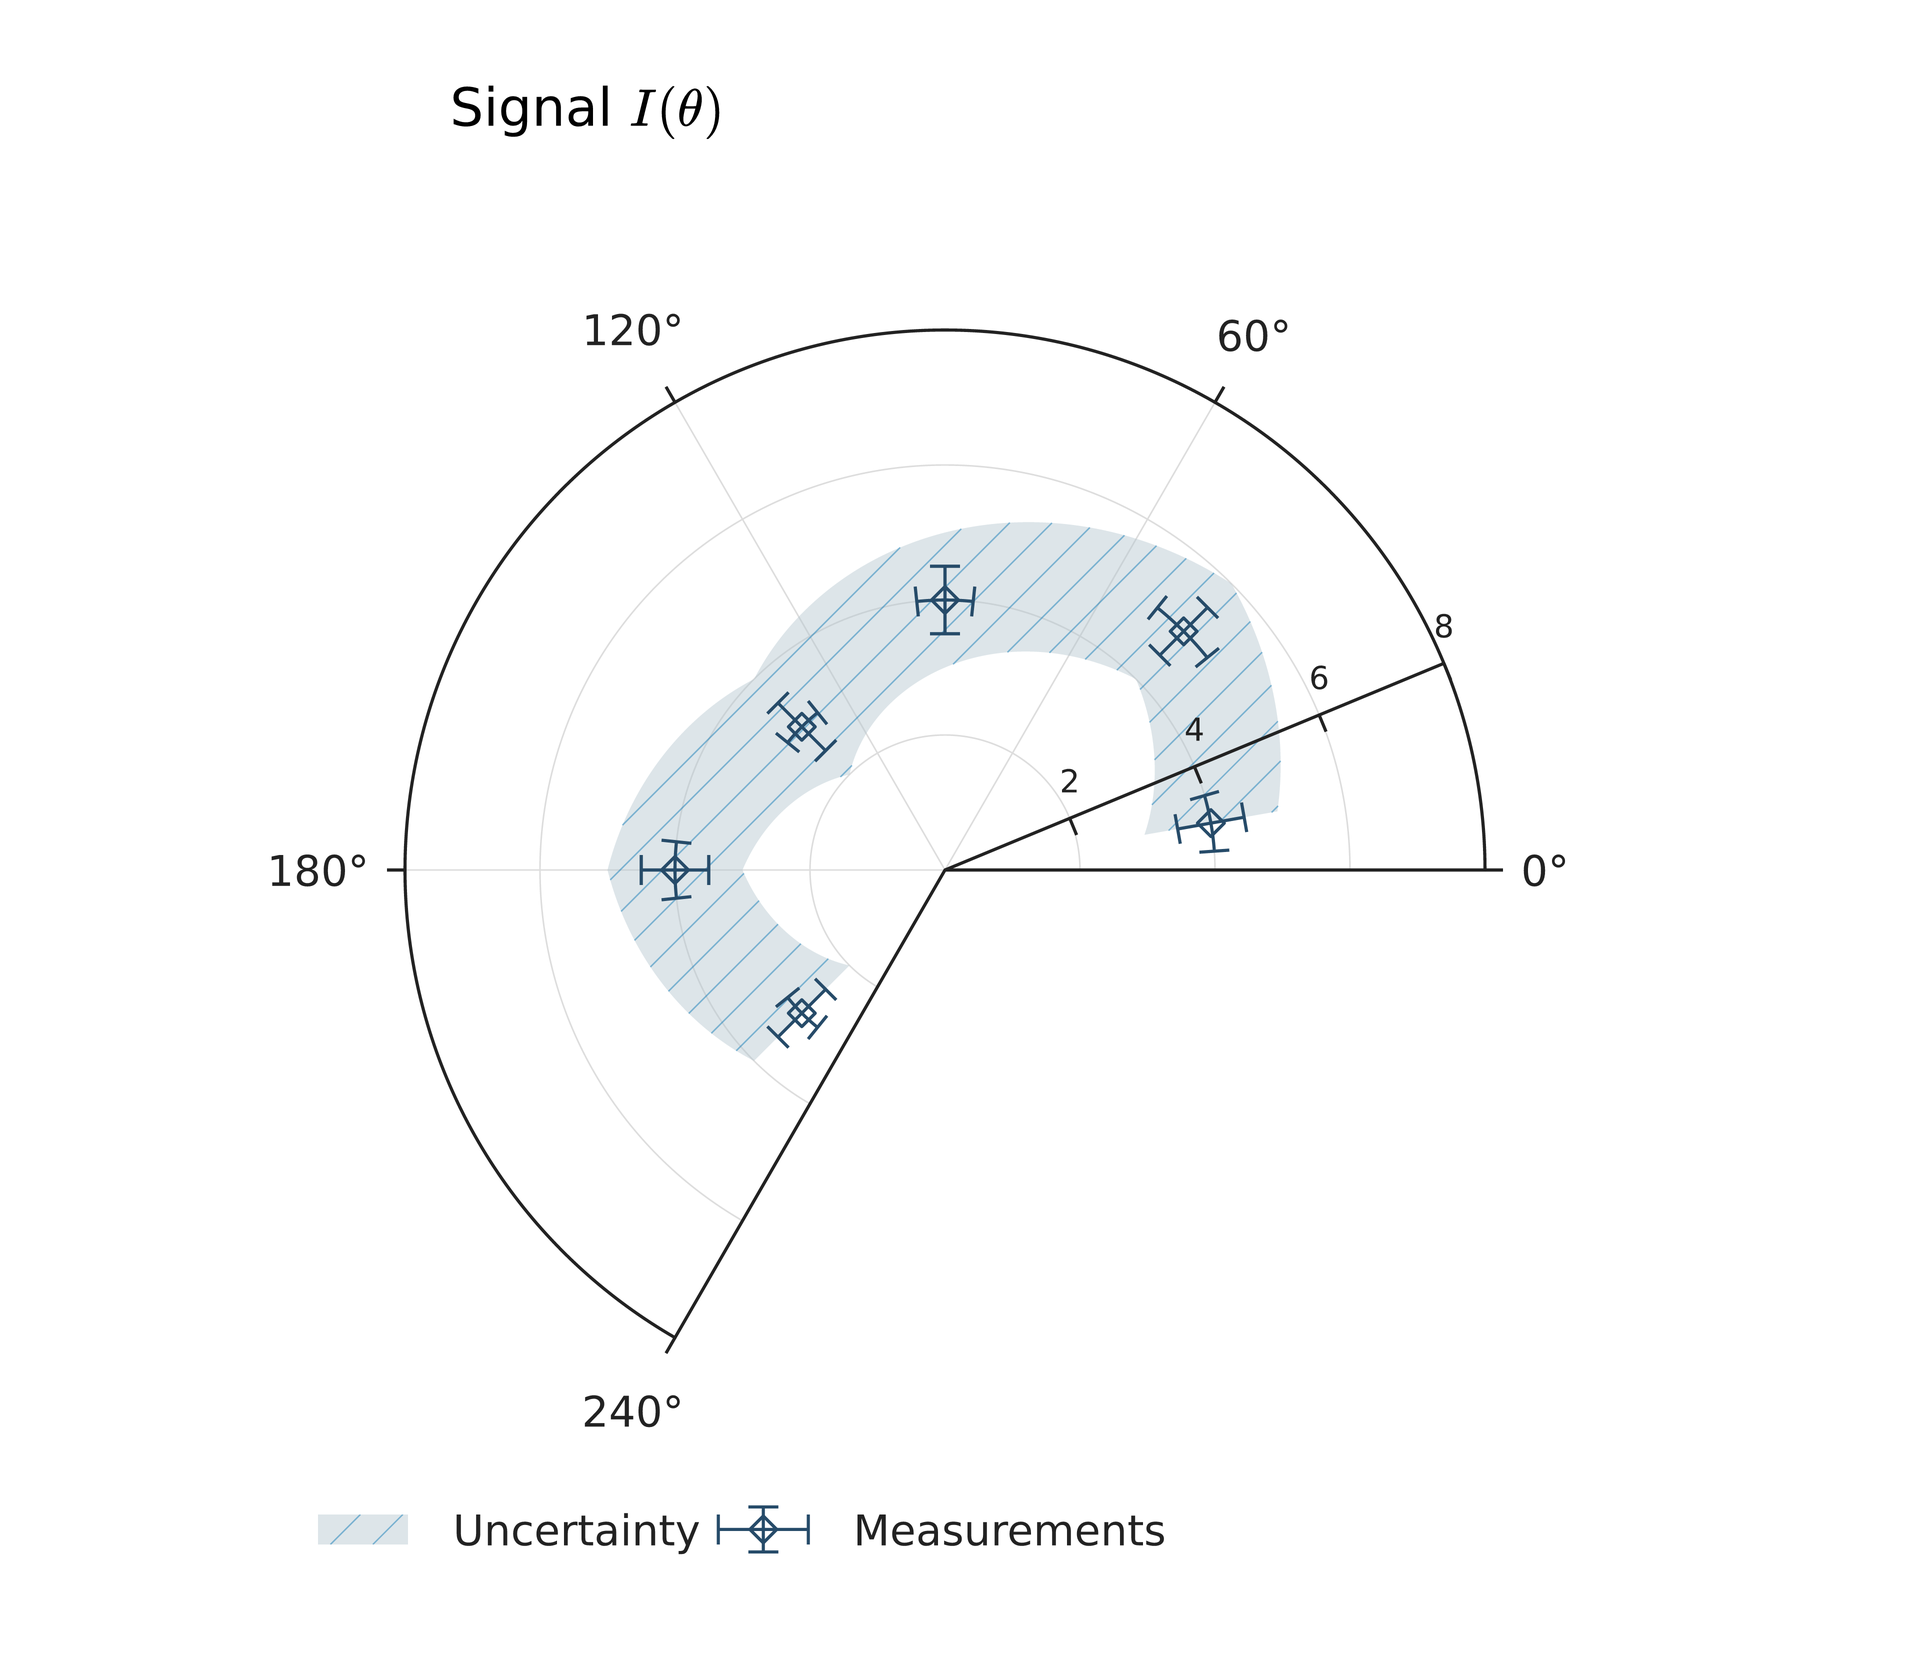
同页对比极坐标 line 的 polar 插值和 chord 弦连接,再叠加角向误差与径向误差。分扇区色块与等值线可共享色标。
page=canvas(size=(128 mm,112 mm),background="#ffffff")s=plot_style(font_family="DejaVu Sans",font_size=8 pt)p=plot(projection= polar,size=(118 mm,100 mm),plot_area=box(offset=(23 mm, 20 mm), size=(72 mm, 72 mm)),style=s, theta=axis(range=(0,240),ticks=[0,60,120,180,240],grid= major),r=axis(range=(0,8),ticks=[2,4,6,8],grid= major,tick_font_size=6 pt))b=p.band(theta=[10,45,90,135,180,225],lower=[3,4,3,2,3,2],upper=[5,6,5,4,5,4],fill="#b3c5ce",hatch="slash",hatch_spacing=2 mm,hatch_width=0.1 mm,opacity=0.45,label="Uncertainty")e=p.errorbar(theta=[10,45,90,135,180,225],r=[4,5,4,3,4,3],thetaerr=6,rerr=0.5,marker= diamond,marker_size=2 mm,marker_fill="none",marker_border_color="#264b69",color="#264b69",cap_size=2 mm,label="Measurements")c=page.add(p,offset=(4 mm,2 mm))page.add(text(spans=[span("Signal "),formula(source=r"I(\theta)",font_size=10 pt)],font_family="DejaVu Sans",font_size=10 pt),offset=(30 mm,5 mm))page.add(legend(layers=[b,e],columns=2,style=s),offset=(20 mm,99 mm))# BEGIN DEMOpage=canvas(size=(128 mm,112 mm),background="#ffffff")s=plot_style(font_family="DejaVu Sans",font_size=8 pt)p=plot(projection= polar,size=(118 mm,100 mm),plot_area=box(offset=(23 mm, 20 mm), size=(72 mm, 72 mm)),style=s, theta=axis(range=(0,240),ticks=[0,60,120,180,240],grid= major),r=axis(range=(0,8),ticks=[2,4,6,8],grid= major,tick_font_size=6 pt))b=p.band(theta=[10,45,90,135,180,225],lower=[3,4,3,2,3,2],upper=[5,6,5,4,5,4],fill="#b3c5ce",hatch="slash",hatch_spacing=2 mm,hatch_width=0.1 mm,opacity=0.45,label="Uncertainty")e=p.errorbar(theta=[10,45,90,135,180,225],r=[4,5,4,3,4,3],thetaerr=6,rerr=0.5,marker= diamond,marker_size=2 mm,marker_fill="none",marker_border_color="#264b69",color="#264b69",cap_size=2 mm,label="Measurements")c=page.add(p,offset=(4 mm,2 mm))page.add(text(spans=[span("Signal "),formula(source=r"I(\theta)",font_size=10 pt)],font_family="DejaVu Sans",font_size=10 pt),offset=(30 mm,5 mm))page.add(legend(layers=[b,e],columns=2,style=s),offset=(20 mm,99 mm))# END DEMO预览
背景
依赖文件
examples/plot/polar-errors.lay
常见错误与限制#
投影在原始几何上处理可见区域;跨零与缺失点会分断路径。数据角度数组不要写带单位长度;仅角度配置参数支持角度单位语法。
逐项功能说明#
详细行为与补充示例#
参数#
| 参数 | 用途 | 默认或要求 |
|---|---|---|
theta / r |
角度与半径数据 | 等长序列 |
plot_area |
物理绘图区 | 显式固定时不自动挤压 |
常见用法#
| 方法 | 极坐标参数 |
|---|---|
line/scatter/step |
theta/r;step 保留 `where="pre |
errorbar |
theta/r 和 thetaerr/rerr;误差支持标量、等长数组、非对称两行数组;角误差是圆弧 |
area |
theta/r/baseline;baseline 是标量或等长数组 |
band |
theta/lower/upper,表示原始径向上下界 |
bar |
positions/values/width/baseline;positions 与 width 是角度,values 是径向增量;默认角宽 20°或其弧度等价值 |
hist |
values/bins/weights/stat;角度先归入一周,默认 10 箱覆盖当前角范围;支持 count/probability/density |
heatmap |
必须提供 z/theta_edges/r_edges;z 的行对应径向、列对应角向,单元格为扇环 |
contour/contourf |
必须提供 z/theta/r/levels;网格递增,可非均匀,使用原始网格计算再投影 |
角度直方图的概率按纳入总权重归一化,密度再除以所选角度单位的箱宽;柱的径向高度表示统计数值,不自动按扇形面积开平方。局部扇区之外的样本排除并警告。所有统计都在原始数据单位进行。
等高线 periodic=true 仅用于整圆,theta 必须是一周内递增、不重复末端的采样;最后一列与第一列相连。默认 false,不推断周期性。缺失采样点的邻接网格单元留空;跨接缝不会重复叠加透明度。热图和等高线的负径向网格使用相同的半周翻转规则。
场图源码 · 误差带与物理纹理 · 角度直方图及显式堆叠。现有 color_scale、局部/独立图例、色标和斜线纹理均可复用。局部色标按绘图区矩形四侧定位;重叠只警告,使用 gap、手动坐标或独立素材自行调整。
本轮极坐标只支持一条角轴、一条径向轴,不支持附加轴、断轴或将箱线/小提琴图直接投影到极坐标;不支持的调用明确报错。