 LayMesh
Colorbars
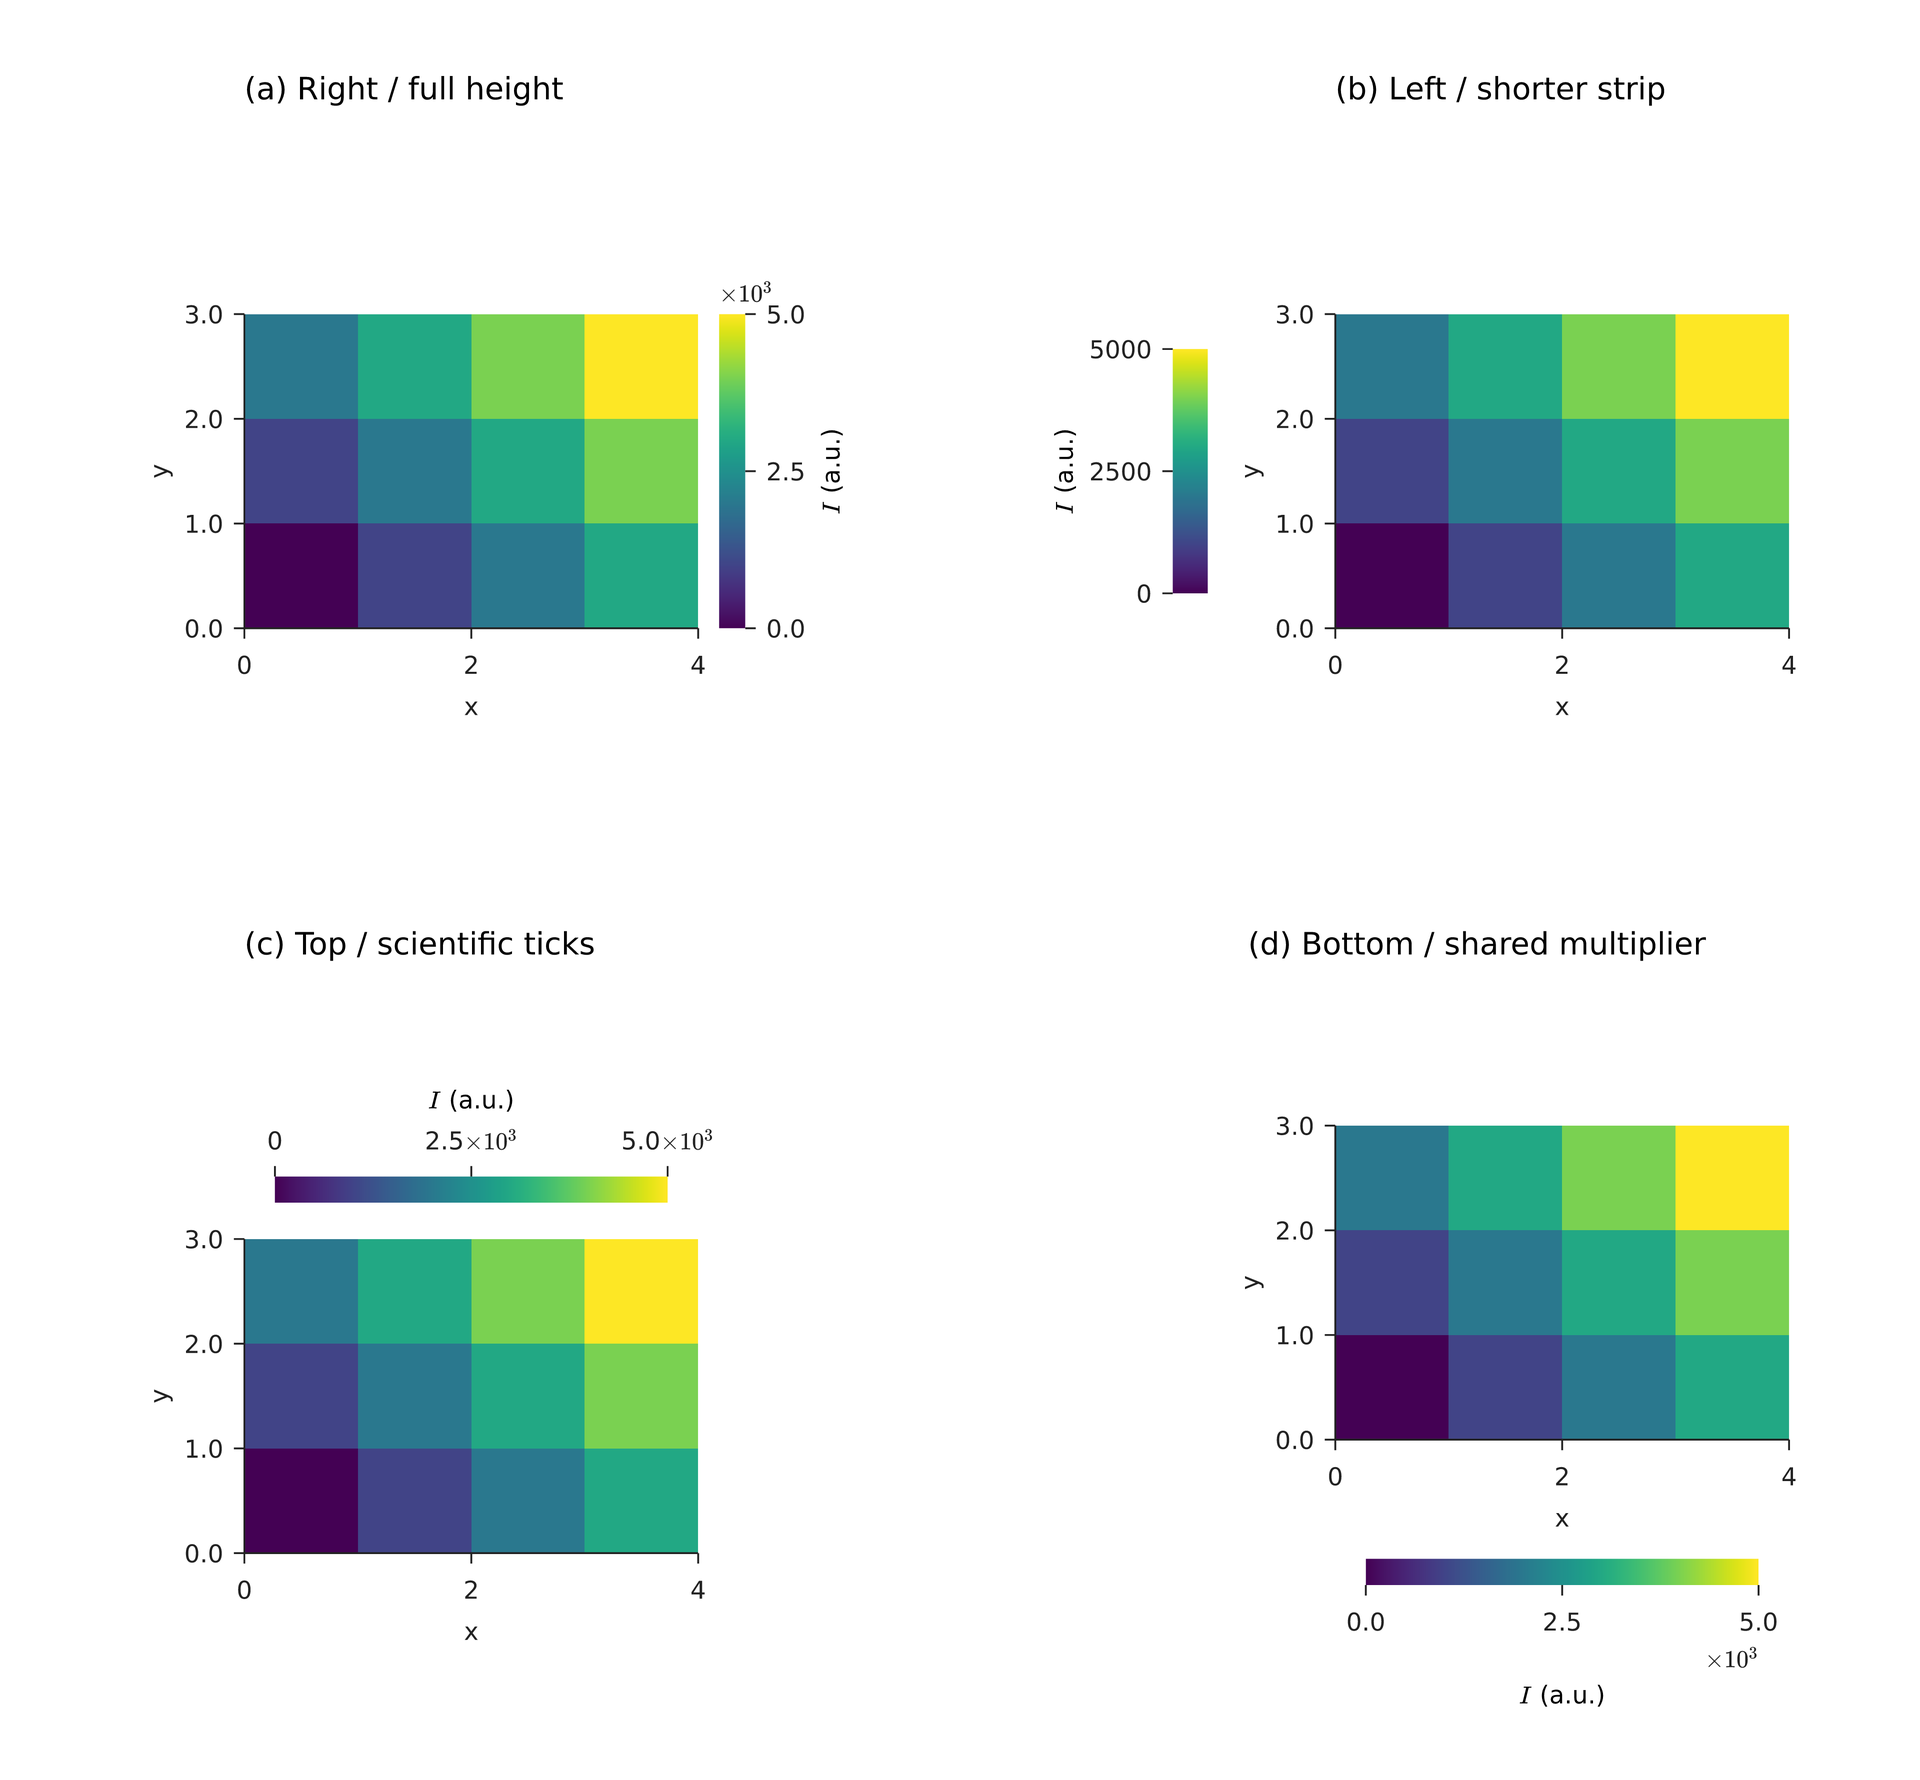
# Each heatmap owns one colorbar. Four positions are edited independently.# Every data rectangle is 52 x 36 mm; changing colorbar length never resizes it.page = canvas(size=(220 mm, 204 mm), background="#ffffff")style = plot_style(font_family="DejaVu Sans", font_size=8 pt)z = [[0, 1000, 2000, 3000], [1000, 2000, 3000, 4000], [2000, 3000, 4000, 5000]]value = text(spans=[formula(source=r"I", font_size=8 pt), span(" (a.u.)")], font_family="DejaVu Sans", font_size=8 pt) right_chart = plot(size=(96 mm, 82 mm), plot_area=box(offset=(22 mm, 25 mm), size=(52 mm, 36 mm)), style=style, x=axis(label="x", ticks=[0, 2, 4]), y=axis(label="y", ticks=[0, 1, 2, 3]))hr = right_chart.heatmap(z=z, vmin=0, vmax=5000)right_chart.colorbar(hr, position= right, ticks=[0, 2500, 5000], notation= offset, format=".1f", label=value)a = page.add(right_chart, anchor= plot_top_left, offset=(28 mm, 36 mm))page.add(text(content="(a) Right / full height", font_family="DejaVu Sans", font_size=10 pt),# Each heatmap owns one colorbar. Four positions are edited independently.# Every data rectangle is 52 x 36 mm; changing colorbar length never resizes it.page = canvas(size=(220 mm, 204 mm), background="#ffffff")style = plot_style(font_family="DejaVu Sans", font_size=8 pt)z = [[0, 1000, 2000, 3000], [1000, 2000, 3000, 4000], [2000, 3000, 4000, 5000]]value = text(spans=[formula(source=r"I", font_size=8 pt), span(" (a.u.)")], font_family="DejaVu Sans", font_size=8 pt) right_chart = plot(size=(96 mm, 82 mm), plot_area=box(offset=(22 mm, 25 mm), size=(52 mm, 36 mm)), style=style, x=axis(label="x", ticks=[0, 2, 4]), y=axis(label="y", ticks=[0, 1, 2, 3]))hr = right_chart.heatmap(z=z, vmin=0, vmax=5000)right_chart.colorbar(hr, position= right, ticks=[0, 2500, 5000], notation= offset, format=".1f", label=value)a = page.add(right_chart, anchor= plot_top_left, offset=(28 mm, 36 mm))page.add(text(content="(a) Right / full height", font_family="DejaVu Sans", font_size=10 pt), target=a.plot_top_left, offset=(0 mm, -28 mm)) left_chart = plot(size=(110 mm, 82 mm), plot_area=box(offset=(43 mm, 25 mm), size=(52 mm, 36 mm)), style=style, x=axis(label="x", ticks=[0, 2, 4]), y=axis(label="y", ticks=[0, 1, 2, 3]))hl = left_chart.heatmap(z=z, vmin=0, vmax=5000)left_chart.colorbar(hl, position= left, length=28 mm, thickness=4 mm, gap=3 mm, ticks=[0, 2500, 5000], format=".0f", label=value)b = page.add(left_chart, anchor= plot_top_left, offset=(153 mm, 36 mm))page.add(text(content="(b) Left / shorter strip", font_family="DejaVu Sans", font_size=10 pt), target=b.plot_top_left, offset=(0 mm, -28 mm)) top_chart = plot(size=(96 mm, 90 mm), plot_area=box(offset=(22 mm, 38 mm), size=(52 mm, 36 mm)), style=style, x=axis(label="x", ticks=[0, 2, 4]), y=axis(label="y", ticks=[0, 1, 2, 3]))ht = top_chart.heatmap(z=z, vmin=0, vmax=5000)top_chart.colorbar(ht, position= top, length=45 mm, ticks=[0, 2500, 5000], notation= scientific, format=".1e", label=value)c = page.add(top_chart, anchor= plot_top_left, offset=(28 mm, 142 mm))page.add(text(content="(c) Top / scientific ticks", font_family="DejaVu Sans", font_size=10 pt), target=c.plot_top_left, offset=(0 mm, -36 mm)) bottom_chart = plot(size=(96 mm, 94 mm), plot_area=box(offset=(22 mm, 25 mm), size=(52 mm, 36 mm)), style=style, x=axis(label="x", ticks=[0, 2, 4]), y=axis(label="y", ticks=[0, 1, 2, 3]))hb = bottom_chart.heatmap(z=z, vmin=0, vmax=5000)bottom_chart.colorbar(hb, position= bottom, length=45 mm, thickness=3 mm, gap=3 mm, ticks=[0, 2500, 5000], notation= offset, exponent=3, format=".1f", label=value)# Manual alternative: replace position= bottom and gap=3 mm above with# position=(3.5 mm, 51 mm), orientation= horizontal. Coordinates start at the data top-left.d = page.add(bottom_chart, anchor= plot_top_left, offset=(153 mm, 129 mm))page.add(text(content="(d) Bottom / shared multiplier", font_family="DejaVu Sans", font_size=10 pt), target=d.plot_top_left, offset=(-10 mm, -23 mm))预览
背景
依赖文件
examples/plot/colorbars.lay
复现
laymesh validate examples/plot/colorbars.laylaymesh render examples/plot/colorbars.lay -o figure.svglaymesh render examples/plot/colorbars.lay -o figure.pdflaymesh render examples/plot/colorbars.lay -o figure.png --dpi 300