LayMesh
标签与科学计数法#
用途与概念#
标签和科学计数法只改变显示,不改原始数据。notation、format 和 exponent 决定刻度文本,独立 label_offset 与 exponent_offset 控制物理位置。
最小完整示例#
此文件包含画布及必要定义,可直接运行 laymesh validate 或 laymesh render,不依赖前文未声明的变量。
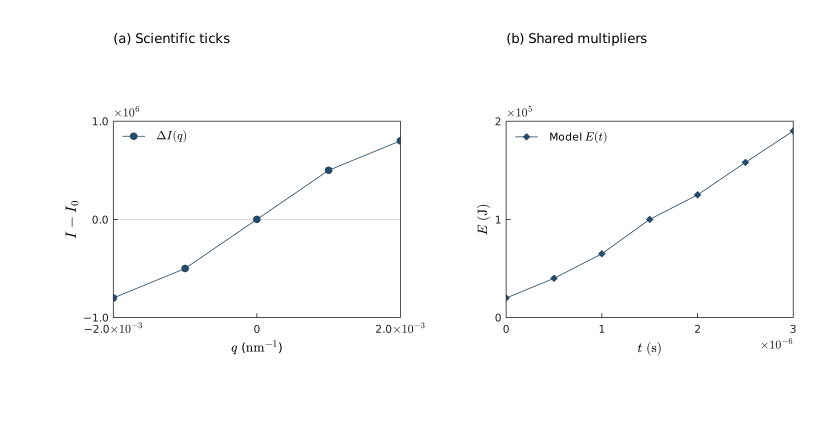
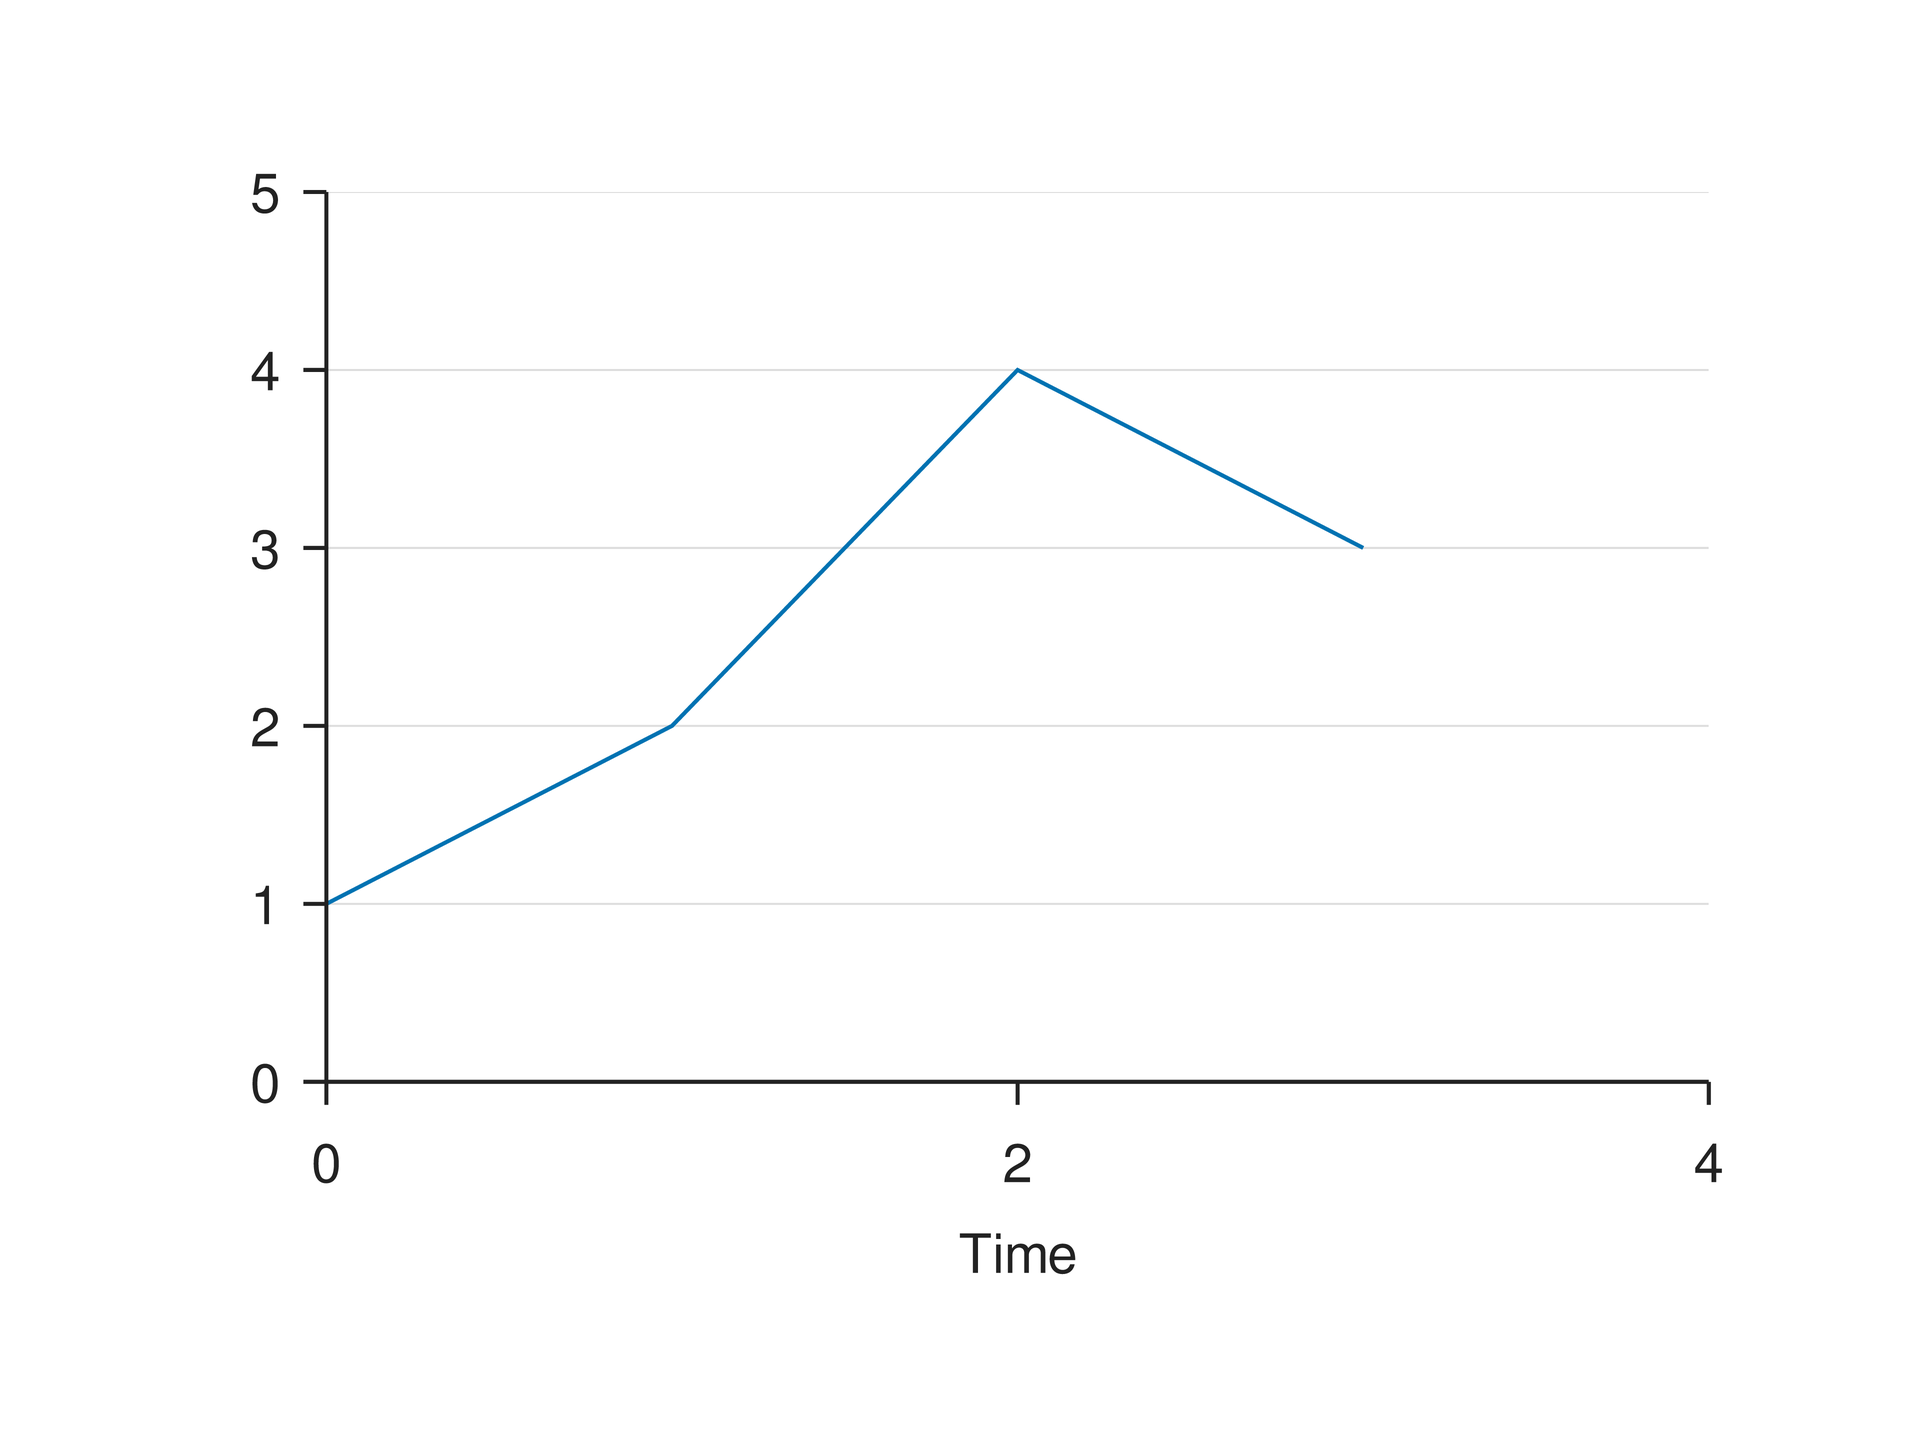
# Minimal complete example: axispage=canvas(size=(100mm,75mm),background="#ffffff")p=plot(size=(86mm,62mm),x=axis(range=(0,4),ticks=[0,2,4],label="Time"),y=axis(range=(0,5),grid=major))p.line(x=[0,1,2,3],y=[1,2,4,3])page.add(p,offset=(7mm,6mm))# Minimal complete example: axispage=canvas(size=(100mm,75mm),background="#ffffff")p=plot(size=(86mm,62mm),x=axis(range=(0,4),ticks=[0,2,4],label="Time"),y=axis(range=(0,5),grid=major))p.line(x=[0,1,2,3],y=[1,2,4,3])page.add(p,offset=(7mm,6mm))预览
依赖文件
examples/manual/axis.lay
参数与默认行为#
裸几何长度使用画布单位,裸字号和描边宽度使用 pt。显式调用参数优先于继承和主题默认值;下面的接口参考逐项列出允许类型、可选值与默认来源。
组合用法#
用 text 或 formula 素材作为 tick_text,可以给不同刻度单独排版。tick_rotation 按标签中心旋转;用固定 plot_area 比较旋转前后的占用空间。
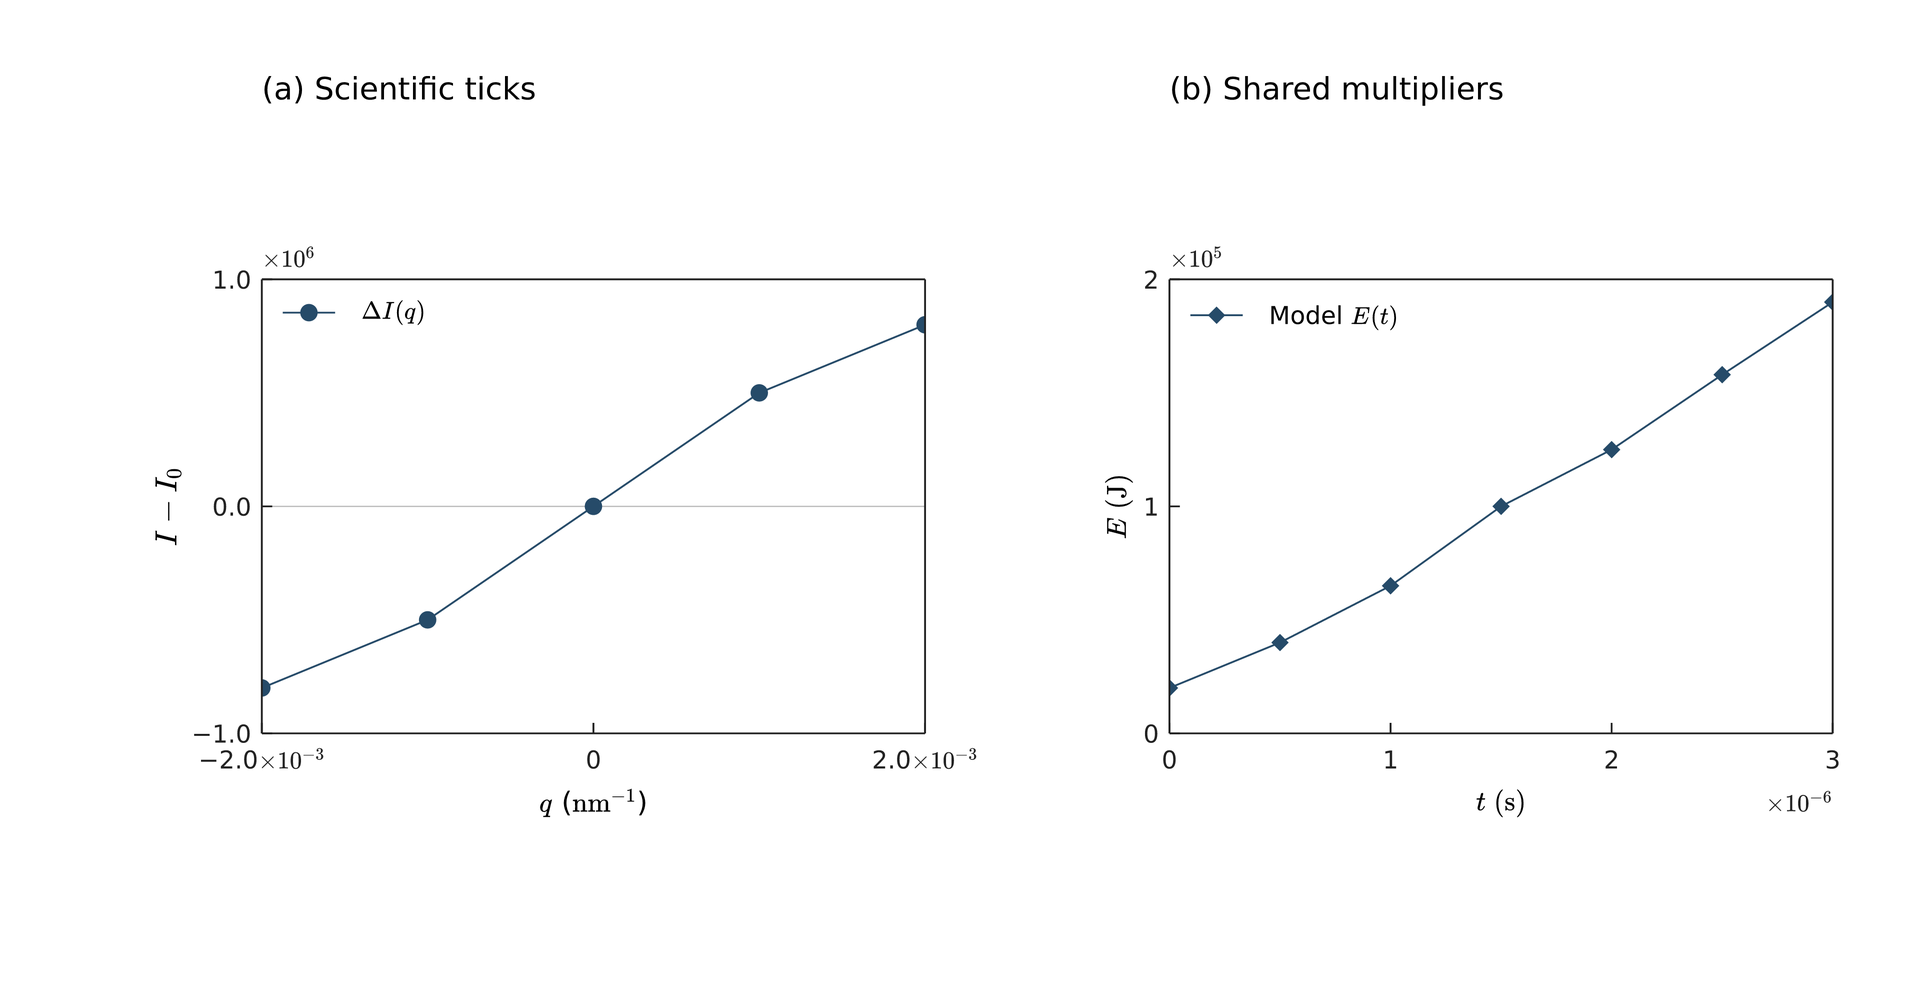
# Two independently placed 76 x 52 mm data rectangles.# Label and exponent offsets are independent chart-local physical lengths (right/down).# The short x title shares the multiplier row; only default collisions add a title row.page = canvas(size=(220 mm, 115 mm), background="#ffffff")style = plot_style(font_family="DejaVu Sans", font_size=8 pt, colors=["#264b69"])q_label = text(spans=[formula(source=r"q", font_size=9 pt), span(" ("), formula(source=r"\mathrm{nm}^{-1}", font_size=9 pt), span(")")], font_family="DejaVu Sans", font_size=9 pt)left = plot(size=(110 mm, 98 mm), plot_area=box(offset=(24 mm, 22 mm), size=(76 mm, 52 mm)), frame= box, style=style, x=axis(label=q_label, range=(-0.002, 0.002), ticks=[-0.002, 0, 0.002], notation= scientific, format=".1e", tick_direction= in), y=axis(label=formula(source=r"I-I_0", font_size=10 pt), range=(-1000000, 1000000), ticks=[-1000000, 0, 1000000], notation= offset, format=".1f", tick_direction= in))left.hline(y=0, color="#bbbbbb", line_width=0.4 pt)# Two independently placed 76 x 52 mm data rectangles.# Label and exponent offsets are independent chart-local physical lengths (right/down).# The short x title shares the multiplier row; only default collisions add a title row.page = canvas(size=(220 mm, 115 mm), background="#ffffff")style = plot_style(font_family="DejaVu Sans", font_size=8 pt, colors=["#264b69"])q_label = text(spans=[formula(source=r"q", font_size=9 pt), span(" ("), formula(source=r"\mathrm{nm}^{-1}", font_size=9 pt), span(")")], font_family="DejaVu Sans", font_size=9 pt)left = plot(size=(110 mm, 98 mm), plot_area=box(offset=(24 mm, 22 mm), size=(76 mm, 52 mm)), frame= box, style=style, x=axis(label=q_label, range=(-0.002, 0.002), ticks=[-0.002, 0, 0.002], notation= scientific, format=".1e", tick_direction= in), y=axis(label=formula(source=r"I-I_0", font_size=10 pt), range=(-1000000, 1000000), ticks=[-1000000, 0, 1000000], notation= offset, format=".1f", tick_direction= in))left.hline(y=0, color="#bbbbbb", line_width=0.4 pt)left.line(x=[-0.002, -0.001, 0, 0.001, 0.002], y=[-800000, -500000, 0, 500000, 800000], marker= circle, marker_size=2 mm, label=formula(source=r"\Delta I(q)", font_size=8 pt))left.legend(position= top_left, background="none")a = page.add(left, anchor= plot_top_left, offset=(30 mm, 32 mm))page.add(text(content="(a) Scientific ticks", font_family="DejaVu Sans", font_size=10 pt), target=a.plot_top_left, offset=(0 mm, -24 mm)) right = plot(size=(110 mm, 98 mm), plot_area=box(offset=(24 mm, 22 mm), size=(76 mm, 52 mm)), frame= box, style=style, x=axis(label=formula(source=r"t\;(\mathrm{s})", font_size=9 pt), range=(0, 0.000003), ticks=[0, 0.000001, 0.000002, 0.000003], notation= offset, exponent=-6, format=".0f", exponent_offset=(0 mm, -0.5 mm), label_offset=(0 mm, 0.5 mm), tick_direction= in), y=axis(label=formula(source=r"E\;(\mathrm{J})", font_size=9 pt), range=(0, 200000), ticks=[0, 100000, 200000], notation= offset, format=".0f", tick_direction= in))right.line(x=[0, 0.0000005, 0.000001, 0.0000015, 0.000002, 0.0000025, 0.000003], y=[20000, 40000, 65000, 100000, 125000, 158000, 190000], marker= diamond, marker_size=2 mm, label=text(spans=[span("Model "), formula(source=r"E(t)", font_size=8 pt)], font_family="DejaVu Sans", font_size=8 pt))right.legend(position= top_left, background="none")b = page.add(right, anchor= plot_top_left, offset=(134 mm, 32 mm))page.add(text(content="(b) Shared multipliers", font_family="DejaVu Sans", font_size=10 pt), target=b.plot_top_left, offset=(0 mm, -24 mm))预览
依赖文件
examples/plot/scientific-labels.lay
常见错误与限制#
显式 text/formula 的样式保留,不会被轴默认字体完全覆盖。科学乘数不应再次乘进输入数据;布局警告说明标签空间不足。
逐项功能说明#
详细行为与补充示例#
参数#
| 参数 | 用途 | 默认或要求 |
|---|---|---|
label |
轴或图例标题 | 字符串、text 或 formula |
tick_text |
自定义刻度文字 | 与 ticks 等长 |
常见用法#
轴、图层图例和色标的 label 接受字符串、text(...) 或 formula(...)。字符串继承图表颜色和对应字号;文字/公式素材使用自身样式,保留指定字号、宽度和换行,不自动缩放。混排使用现有 text(spans=[...]);相对字体路径仍按定义素材的 .lay 文件解析。
坐标轴和 colorbar(...) 共用下列参数:
| 选项 | 显示规则 |
|---|---|
notation="plain" |
默认,保持现有数字格式;如需原来的 1.00e+6 文本,可用 format=".2e" |
notation="scientific" |
每个非零刻度显示 a×10ⁿ,指数为数学上标;默认精度 .2e,显式 format 必须为指数类型 e。零始终显示 0,进位后同步更新指数 |
notation="offset" |
全轴共用 ×10ⁿ;自动指数由原始范围最大绝对值的十进制数量级确定;指数为零时省略倍率 |
exponent=6 |
仅用于 offset,显式指定整数指数;支持可表示的倍率范围 -323…308,刻度换算溢出时报告错误 |
format=".1f" |
在 offset 中作用于除以倍率后的刻度;例如原值 1500000、指数 6 显示 1.5 |
exponent_offset=(dx,dy) |
仅用于 offset,默认 (0 mm,0 mm);倍率的物理位移,x 向右、y 向下,可为负值 |
横轴倍率默认放在刻度下方靠右,纵轴倍率在上方靠左;tick_labels=false 也隐藏倍率。倍率和标签的实际尺寸参与外围空间测量。notation/format/exponent 只改变显示,数据及 chart.data(...) 均使用原始数值,线性/对数映射不变。固定留白或 plot_area 不足时只警告,不重排数据区域;手动多面板的位置保持不变。
横轴标题默认居中,与横轴倍率共用刻度下方的一行。只有两者在默认位置的实测边界重叠时,才把标题放到倍率下方,间隔 1.2 mm;公式上下标、文字宽度及换行均参与测量。没有横轴统一倍率时保留原有默认标题位置。
axis(label_offset=(dx,dy)) 独立微调轴标题,exponent_offset 独立微调倍率。先完成默认定位和上述碰撞处理,再施加偏移;移动倍率不会带动标题,移动标题也不会带动倍率。偏移沿图表局部物理坐标,x 向右、y 向下,随后随图表旋转或所在组缩放。纵轴标题旋转 90° 后仍按这两个局部方向平移。偏移造成标题与倍率重叠或空间不足时报告 W_PLOT_LAYOUT,保留用户设置。自动留白会测量所需空间;原有贴外框边缘的标题若被手动移到外框之外,也会保留位置并警告,可用 plot_area 明确预留空间。色标继续使用原有布局规则,也支持独立 label_offset。
更复杂的标题布局可使用独立的 page.add(text(...)) 或 group.add(text(...)),并以绘图区锚点定位。
可编辑源码 · SVG · PDF。两个绘图区明确设为 76 × 52 mm,页面左上角分别是 (30,32) mm 和 (134,32) mm;右图横轴标题向下 0.5 mm、倍率向上 0.5 mm,数据区域保持不变。