LayMesh
数据锚点与标注#
用途与概念#
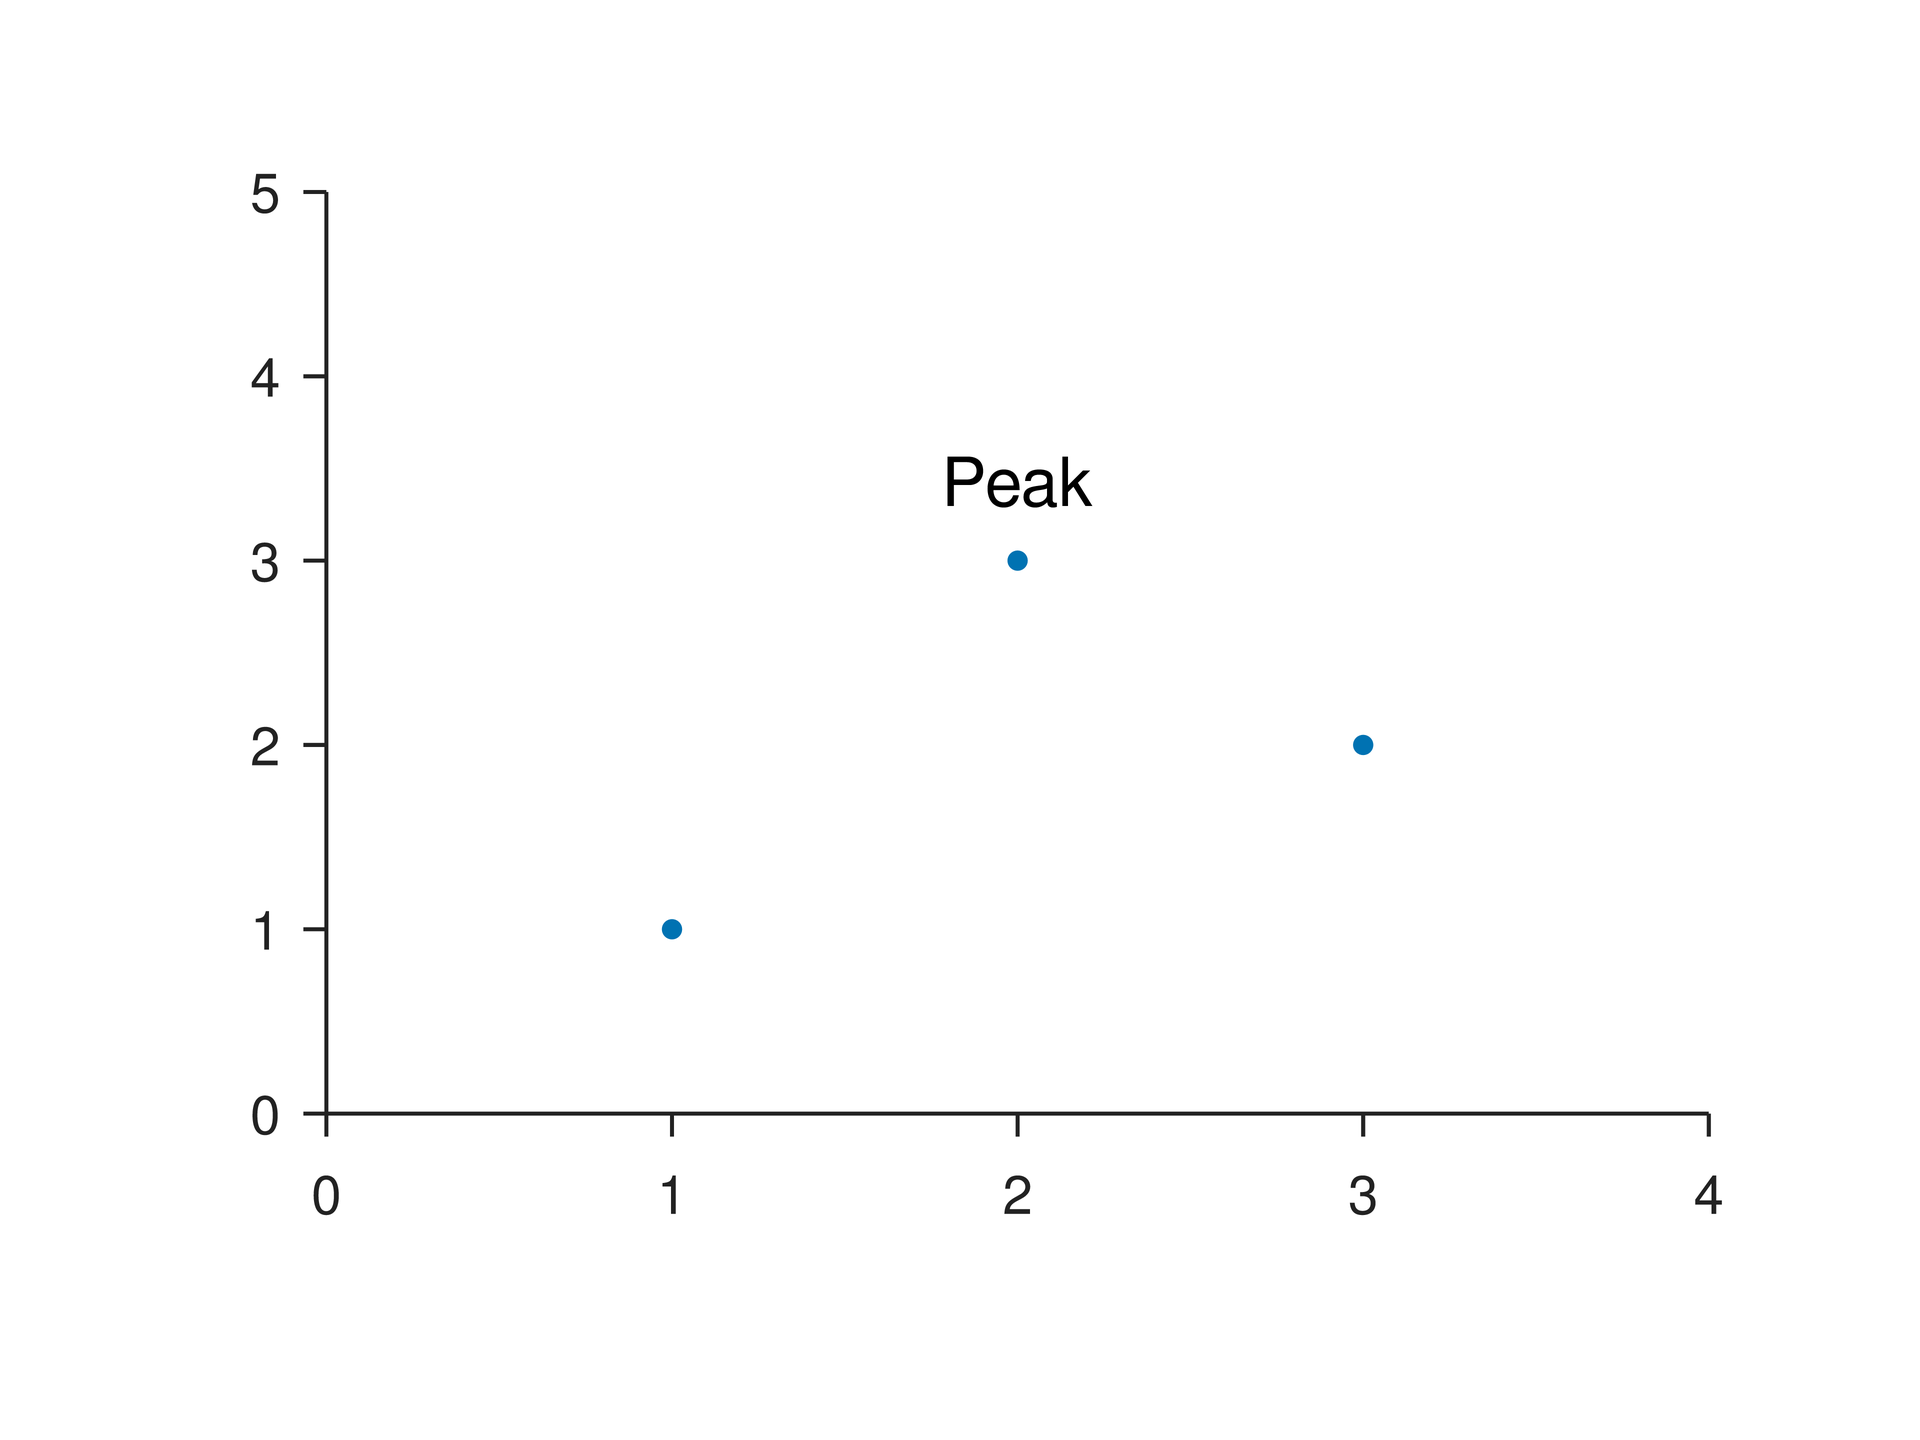
数据锚点把原始数据数值转换到实例坐标。chart.data(x=...,y=...) 可以定位文字和连接线,跟随轴变换、实例旋转和组缩放。hline/vline 则在数据区内画参考线。
最小完整示例#
此文件包含画布及必要定义,可直接运行 laymesh validate 或 laymesh render,不依赖前文未声明的变量。
# Minimal complete example: instance.datapage=canvas(size=(100mm,75mm),background="#ffffff")p=plot(size=(86mm,62mm),x=axis(range=(0,4)),y=axis(range=(0,5)))p.scatter(x=[1,2,3],y=[1,3,2])chart=page.add(p,offset=(7mm,6mm))page.add(text("Peak"),target=chart.data(x=2,y=3),anchor=bottom_center,offset=(0mm,-2mm))# Minimal complete example: instance.datapage=canvas(size=(100mm,75mm),background="#ffffff")p=plot(size=(86mm,62mm),x=axis(range=(0,4)),y=axis(range=(0,5)))p.scatter(x=[1,2,3],y=[1,3,2])chart=page.add(p,offset=(7mm,6mm))page.add(text("Peak"),target=chart.data(x=2,y=3),anchor=bottom_center,offset=(0mm,-2mm))预览
依赖文件
examples/manual/instance-data.lay
参数与默认行为#
裸几何长度使用画布单位,裸字号和描边宽度使用 pt。显式调用参数优先于继承和主题默认值;下面的接口参考逐项列出允许类型、可选值与默认来源。
组合用法#
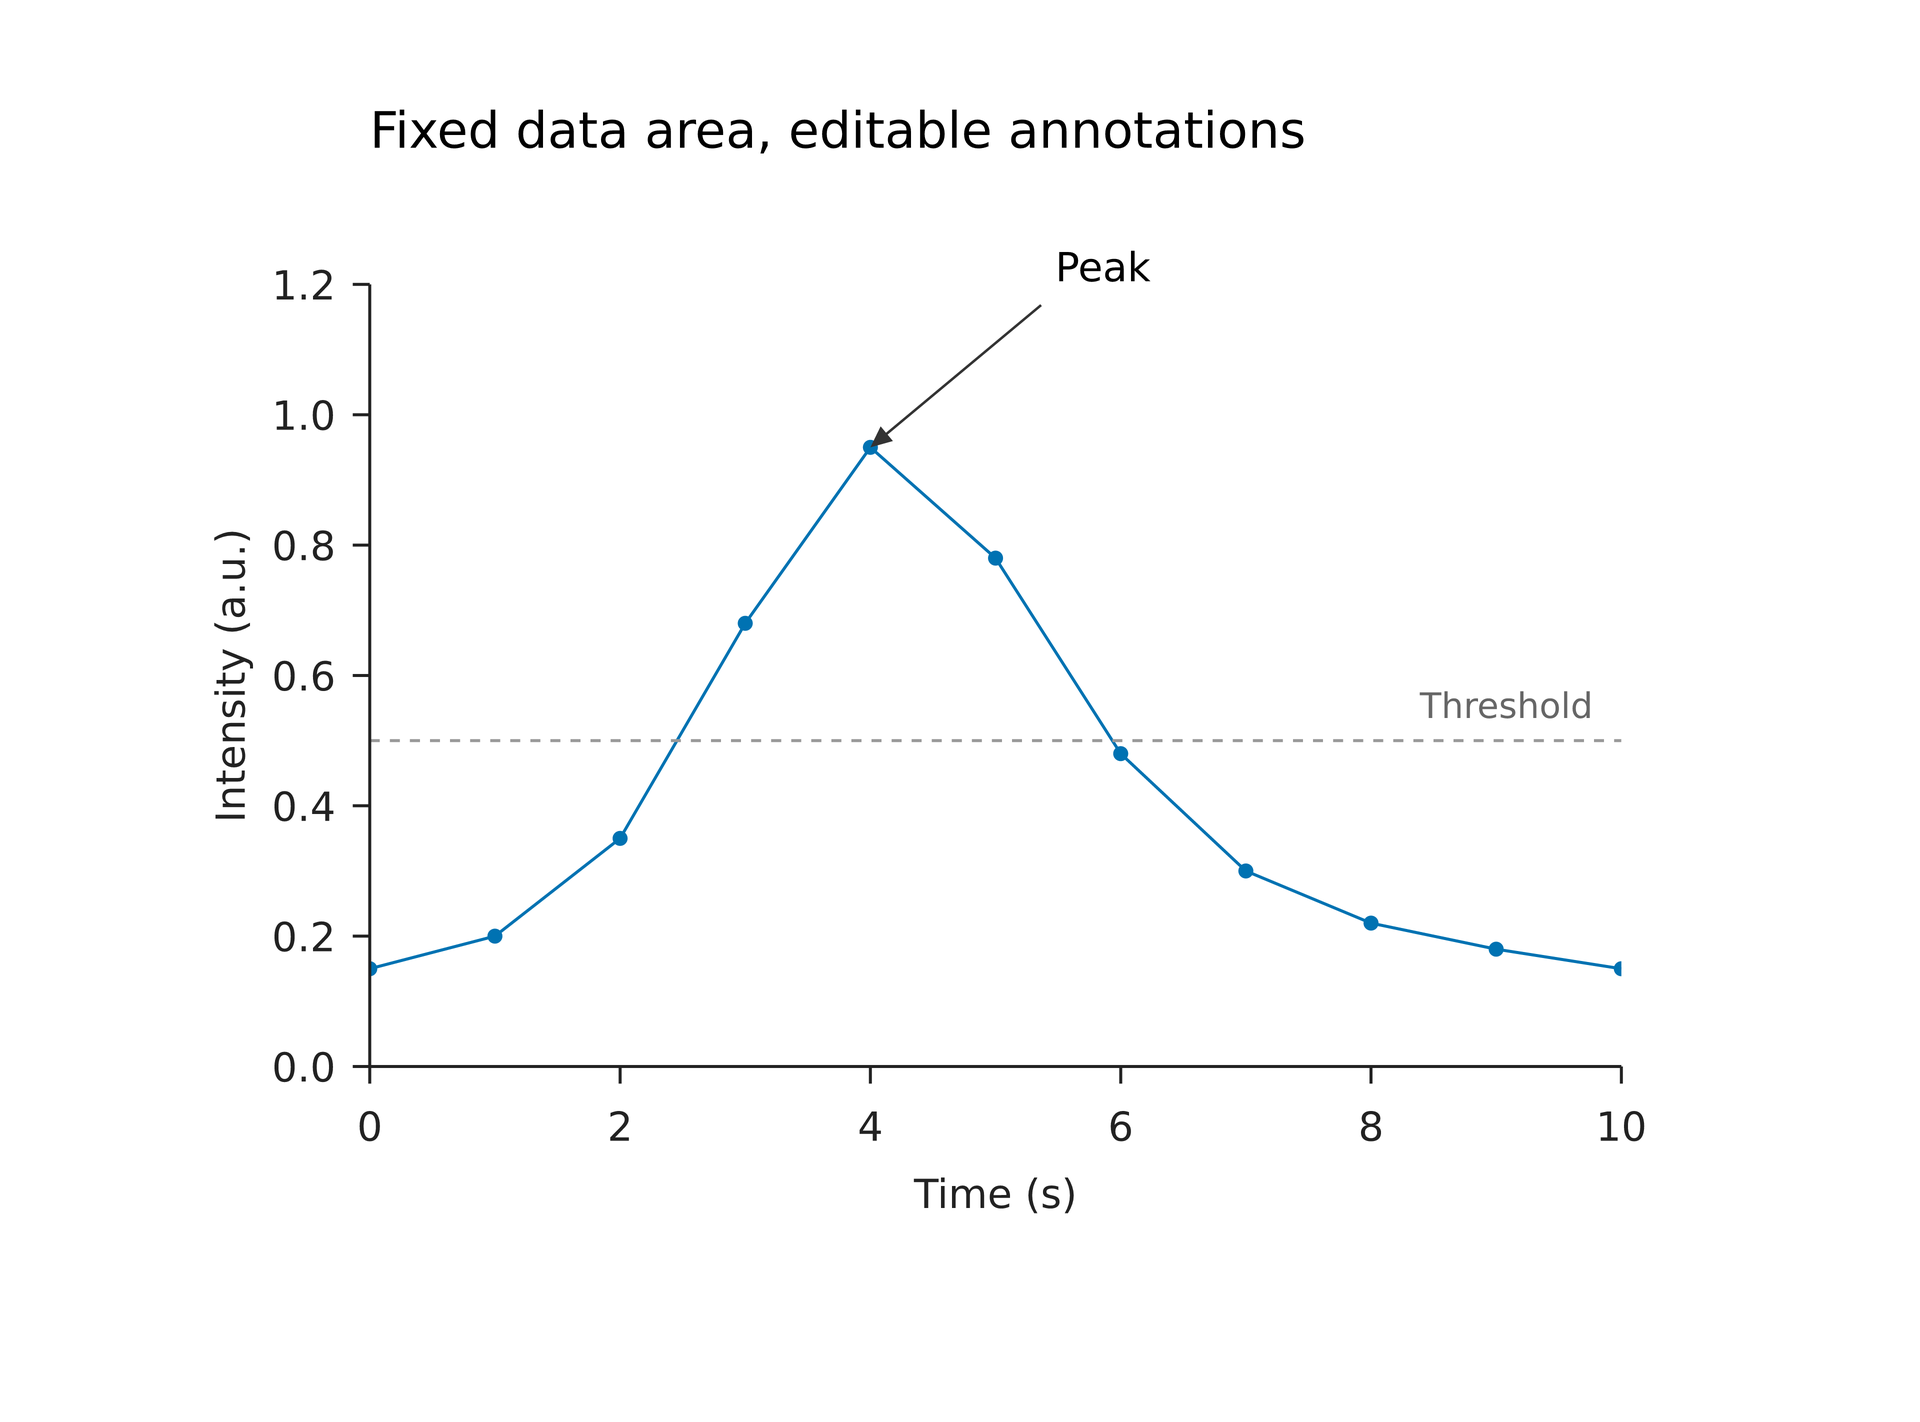
把文字自身 bottom_center 对齐数据点,再使用物理 offset 留空。命名轴数据锚点可指定 x_axis/y_axis,适合将副轴曲线与注释一起复用。
# The data rectangle stays 88 x 55 mm, with its top-left corner at (26, 20) mm.page = canvas(size=(135 mm, 100 mm), background="#ffffff")style = plot_style(font_family="DejaVu Sans", font_size=8 pt, line_width=0.6 pt)p = plot(size=(120 mm, 84 mm), plot_area=box(offset=(18 mm, 8 mm), size=(88 mm, 55 mm)), x=axis(label="Time (s)", range=(0, 10)), y=axis(label="Intensity (a.u.)", range=(0, 1.2), format=".1f"), style=style)p.line(x=[0, 1, 2, 3, 4, 5, 6, 7, 8, 9, 10], y=[0.15, 0.2, 0.35, 0.68, 0.95, 0.78, 0.48, 0.3, 0.22, 0.18, 0.15])p.scatter(x=[0, 1, 2, 3, 4, 5, 6, 7, 8, 9, 10], y=[0.15, 0.2, 0.35, 0.68, 0.95, 0.78, 0.48, 0.3, 0.22, 0.18, 0.15], color="#0072B2", marker_size=3 pt)p.hline(y=0.5, color="#999999", line_dash=[2 pt, 2 pt]) # Outer dimensions may change; this placement pins the data origin on the page.# The data rectangle stays 88 x 55 mm, with its top-left corner at (26, 20) mm.page = canvas(size=(135 mm, 100 mm), background="#ffffff")style = plot_style(font_family="DejaVu Sans", font_size=8 pt, line_width=0.6 pt)p = plot(size=(120 mm, 84 mm), plot_area=box(offset=(18 mm, 8 mm), size=(88 mm, 55 mm)), x=axis(label="Time (s)", range=(0, 10)), y=axis(label="Intensity (a.u.)", range=(0, 1.2), format=".1f"), style=style)p.line(x=[0, 1, 2, 3, 4, 5, 6, 7, 8, 9, 10], y=[0.15, 0.2, 0.35, 0.68, 0.95, 0.78, 0.48, 0.3, 0.22, 0.18, 0.15])p.scatter(x=[0, 1, 2, 3, 4, 5, 6, 7, 8, 9, 10], y=[0.15, 0.2, 0.35, 0.68, 0.95, 0.78, 0.48, 0.3, 0.22, 0.18, 0.15], color="#0072B2", marker_size=3 pt)p.hline(y=0.5, color="#999999", line_dash=[2 pt, 2 pt]) # Outer dimensions may change; this placement pins the data origin on the page.chart = page.add(p, anchor= plot_top_left, target=page.top_left, offset=(26 mm, 20 mm)) # Only this coordinate depends on the data. The arrow and label offsets use mm.peak = chart.data(x=4, y=0.95)pointer = page.add(line(end_head=head(), dx=-12 mm, dy=10 mm, line_color="#333333", line_width=0.5 pt), anchor= end, target=peak)page.add(text(content="Peak", font_family="DejaVu Sans", font_size=8 pt), anchor=bottom_left, target=pointer.start, offset=(1 mm, -1 mm))page.add(text(content="Threshold", font_family="DejaVu Sans", font_size=7 pt, color="#666666"), anchor=bottom_right, target=chart.data(x=10, y=0.5), offset=(-2 mm, -1 mm))page.add(text(content="Fixed data area, editable annotations", font_family="DejaVu Sans", font_size=10 pt), target=chart.plot_top_left, offset=(0 mm, -13 mm))预览
依赖文件
examples/plot/annotations.lay
常见错误与限制#
普通素材 p 不是已放置图表;应使用 chart=page.add(p) 的返回值。断轴隐藏区的数据锚点报错,越界不会被偷偷夹到边缘。
逐项功能说明#
plot-hline#
水平参考线图层:向当前图表添加数据,通过物理样式参数控制外观,并使用命名轴参数选择数据映射。
返回:图层句柄,可用于共享图例。
plot-vline#
垂直参考线图层:向当前图表添加数据,通过物理样式参数控制外观,并使用命名轴参数选择数据映射。
返回:图层句柄,可用于共享图例。
详细行为与补充示例#
参数#
| 参数 | 用途 | 默认或要求 |
|---|---|---|
data(x=..., y=...) |
数据坐标定位 | 使用原始数据单位 |
plot_* |
绘图区九点锚点 | 随实例变换 |
常见用法#
plot_area=box(offset=(左,上), size=(宽,高)) 的四个值都是物理长度,相对于图表外框。左、上非负,宽、高为正,边界须为有限值;超出 size 时给出警告并保留设置。它与固定四边 margins 的区别是:覆盖外框 size=(width, height) 时,绘图区位置和尺寸仍固定,只有外围空间改变。字号、刻度、轴标签、图例或色标的修改也不会挤压绘图区;空间不足会报带源码位置的 W_PLOT_LAYOUT 并继续出图。锁定模式下,轴标签和色标标签随各自坐标轴定位,不会漂到扩大的外框边缘。
chart.data(x=..., y=...)返回已放置图表实例的数据锚点。x/y 是有限、无单位的数值,支持线性轴、正值对数轴和自动范围。锚点按该实例最终绘图区计算,不改变数据范围;修改轴范围并重新编译后,标注仍对应同一数据值。端点允许使用,超出轴范围报错,不静默钳制。- 标注的
offset是同一容器中的物理位移。可以把文字移到绘图区外;文字、箭头等是独立页面元素,不受数据层裁剪,也不自动避让或计入图表外框。 - 图表实例有九个绘图区锚点:
plot_top_left/plot_top_center/plot_top_right、plot_middle_left/plot_center/plot_middle_right、plot_bottom_left/plot_bottom_center/plot_bottom_right。可作为target=chart.plot_top_left,也可用字符串anchor="plot_top_left"将数据区域直接定位到页面。 anchor="start"/"end"可定位线段和箭头端点;pointer.start/end可继续放置文字。绘图区和端点锚点随实例旋转;原有九个外框锚点仍取旋转后的轴对齐外接框。新增锚点名须在anchor中加引号,没有新增保留字。- 目标与标注必须位于同一画布或组内。图表及标注一同放入 group 后,整体缩放和旋转会同步作用于两者;此时物理尺寸也按已有 group 规则缩放。每个图表实例均可单独定位和微调。
数据值、绘图区锚点和物理偏移可以直接组合。anchor 指所放元素自身的对齐点,target 指目标位置;示例中的位移沿页面坐标方向,而非图表旋转后的局部方向。
可编辑源码 · SVG · PDF。示例绘图区为 88 × 55 mm,左上角固定在页面 (26, 20) mm;峰值箭头、阈值文字和标题分别放置。