 LayMesh
绘图区与物理尺寸#
用途与概念#
页面 size、图表 size 和绘图区大小是三层不同尺寸。plot_area=box(...) 明确数据区域的物理位置与宽高,适合多个实验图保持相同可比较比例。
最小完整示例#
此文件包含画布及必要定义,可直接运行 laymesh validate 或 laymesh render,不依赖前文未声明的变量。
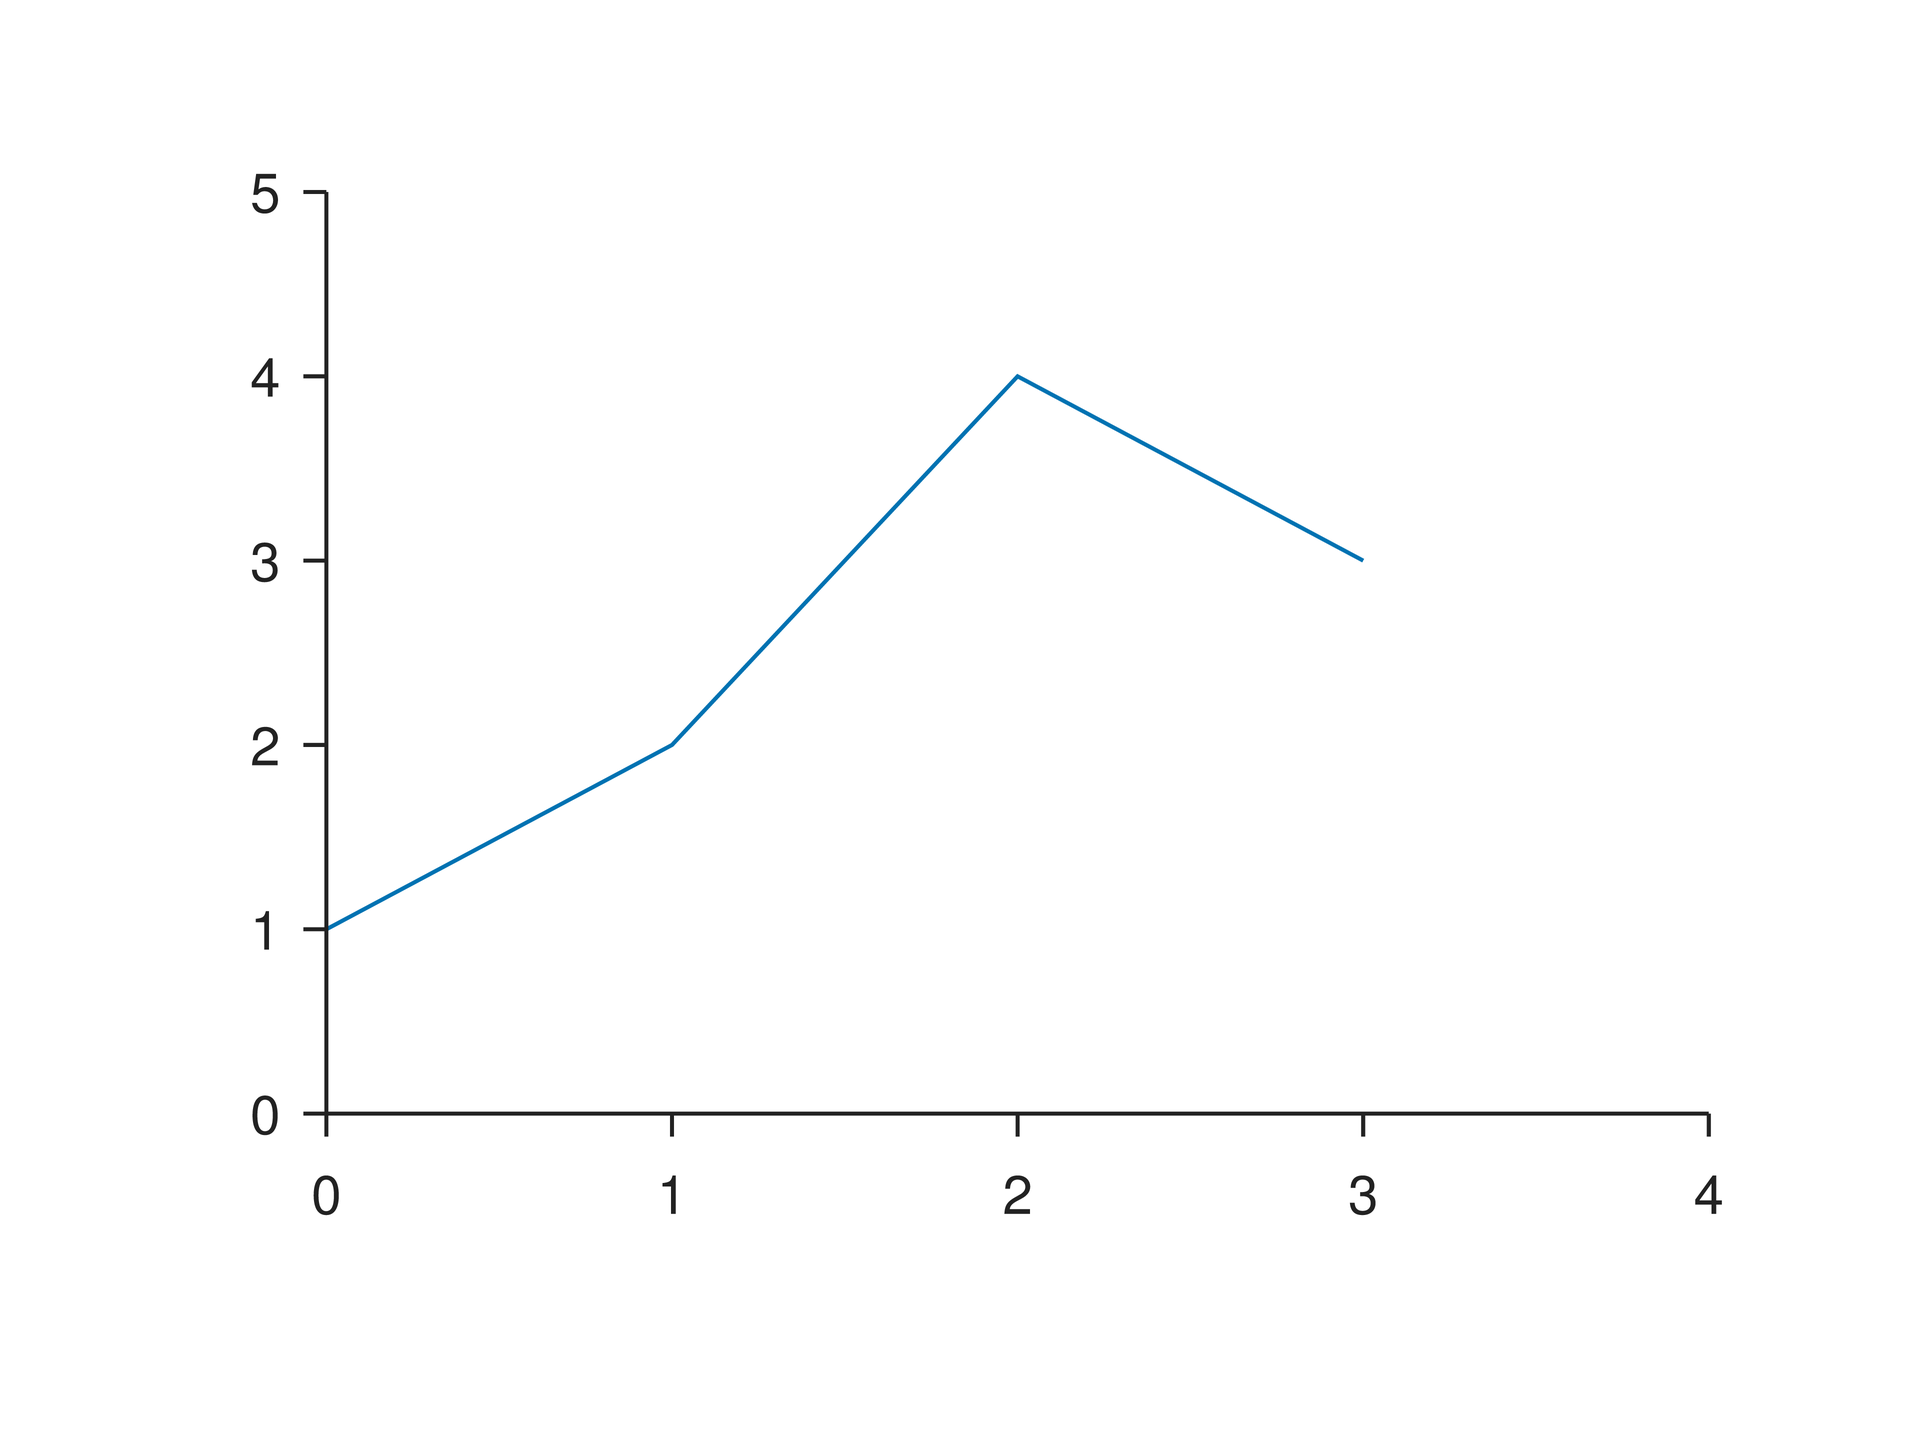
# Minimal complete example: plotpage=canvas(size=(100mm,75mm),background="#ffffff")p=plot(size=(86mm,62mm),x=axis(range=(0,4)),y=axis(range=(0,5)))p.line(x=[0,1,2,3],y=[1,2,4,3],label="Signal")page.add(p,offset=(7mm,6mm))# Minimal complete example: plotpage=canvas(size=(100mm,75mm),background="#ffffff")p=plot(size=(86mm,62mm),x=axis(range=(0,4)),y=axis(range=(0,5)))p.line(x=[0,1,2,3],y=[1,2,4,3],label="Signal")page.add(p,offset=(7mm,6mm))预览
依赖文件
examples/manual/plot.lay
参数与默认行为#
裸几何长度使用画布单位,裸字号和描边宽度使用 pt。显式调用参数优先于继承和主题默认值;下面的接口参考逐项列出允许类型、可选值与默认来源。
组合用法#
显式 plot_area 在图表实例重排时保留数据区域;margins 固定边距,数据区域随外框变化。共享 plot_style 可统一文字与描边默认值,但显式层参数仍优先。
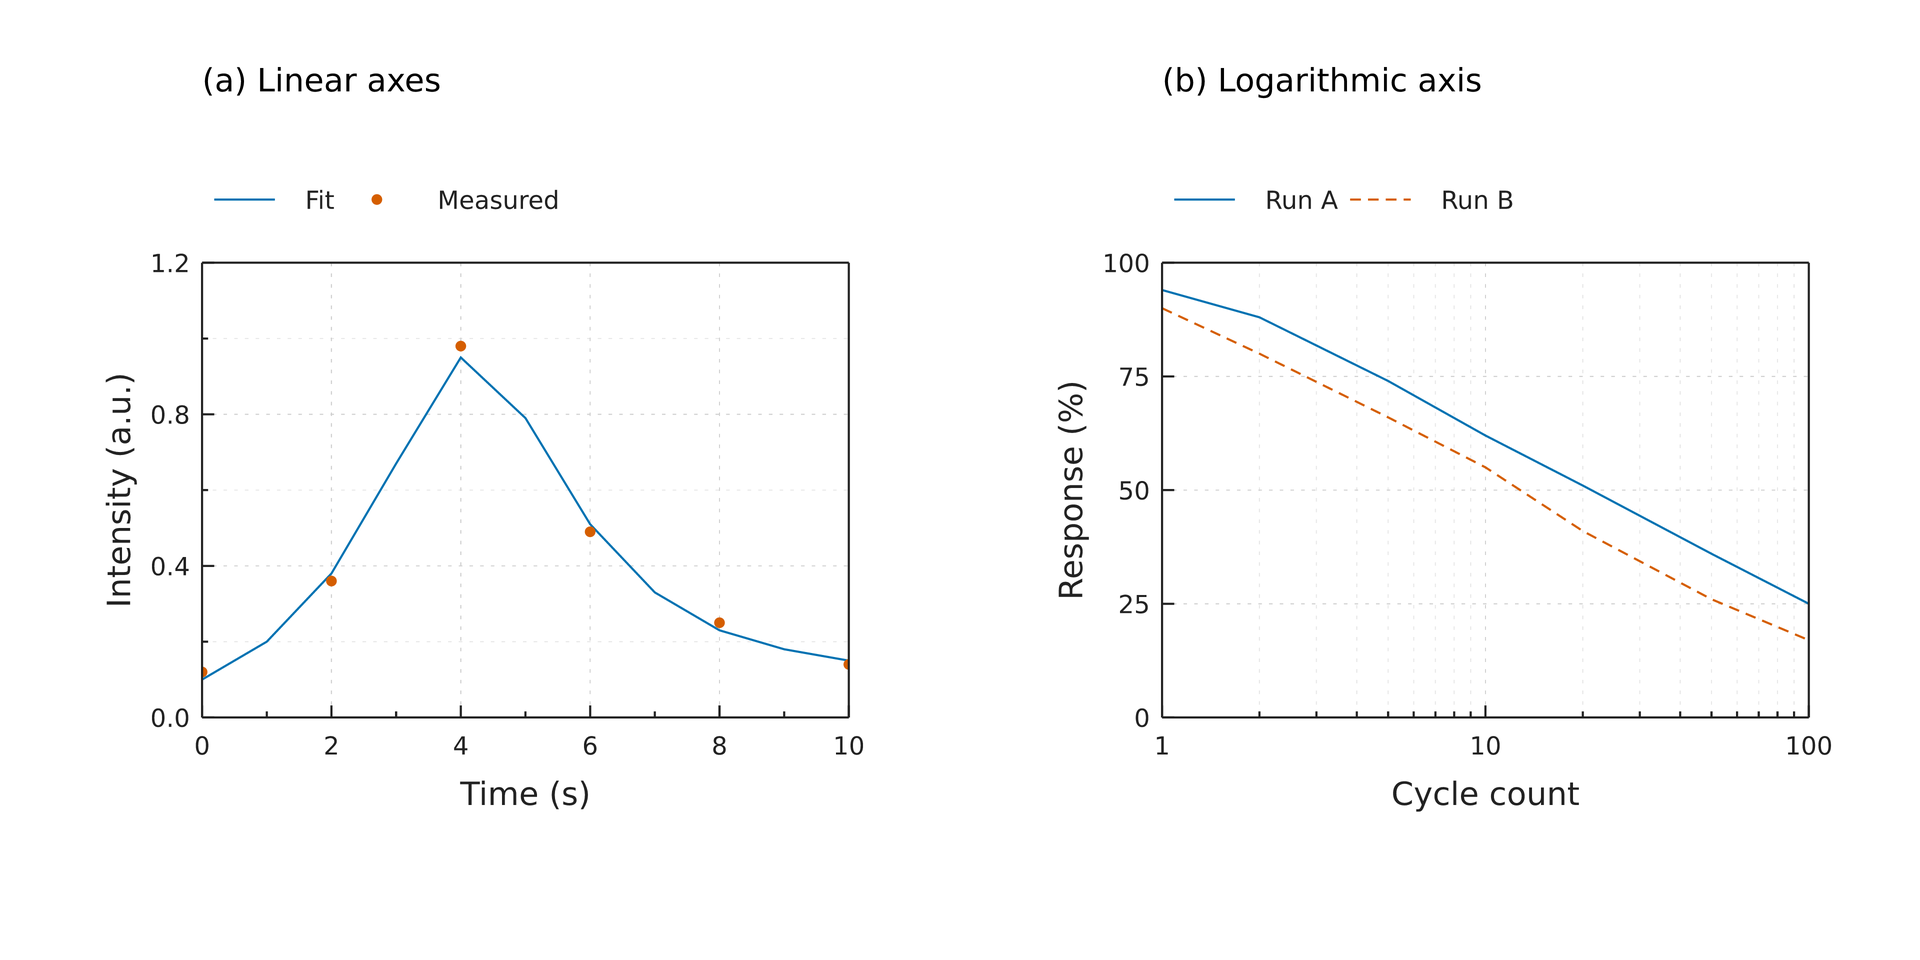
# Each data rectangle is explicitly 64 x 45 mm. Placement uses data-area anchors.# Changing ticks, label sizes or legends never aligns or resizes the other panel.page = canvas(size=(190 mm, 95 mm), background="#ffffff")style = plot_style(font_family="DejaVu Sans", font_size=8 pt, tick_font_size=7 pt, label_font_size=9 pt, grid_color="#d0d0d0", grid_line_width=0.3 pt, grid_line_dash=[1 pt, 2 pt]) left = plot(size=(87 mm, 82 mm), plot_area=box(offset=(17 mm, 18 mm), size=(64 mm, 45 mm)), frame= box, x=axis(label="Time (s)", range=(0, 10), ticks=[0, 2, 4, 6, 8, 10], minor_ticks=[1, 3, 5, 7, 9], tick_direction= in, grid= major), y=axis(label="Intensity (a.u.)", range=(0, 1.2), ticks=[0, 0.4, 0.8, 1.2], format=".1f", minor_ticks=[0.2, 0.6, 1.0], tick_direction= in, grid= both), style=style)left.line(x=[0, 1, 2, 3, 4, 5, 6, 7, 8, 9, 10], y=[0.1, 0.2, 0.38, 0.67, 0.95, 0.79, 0.51, 0.33, 0.23, 0.18, 0.15], label="Fit")# Each data rectangle is explicitly 64 x 45 mm. Placement uses data-area anchors.# Changing ticks, label sizes or legends never aligns or resizes the other panel.page = canvas(size=(190 mm, 95 mm), background="#ffffff")style = plot_style(font_family="DejaVu Sans", font_size=8 pt, tick_font_size=7 pt, label_font_size=9 pt, grid_color="#d0d0d0", grid_line_width=0.3 pt, grid_line_dash=[1 pt, 2 pt]) left = plot(size=(87 mm, 82 mm), plot_area=box(offset=(17 mm, 18 mm), size=(64 mm, 45 mm)), frame= box, x=axis(label="Time (s)", range=(0, 10), ticks=[0, 2, 4, 6, 8, 10], minor_ticks=[1, 3, 5, 7, 9], tick_direction= in, grid= major), y=axis(label="Intensity (a.u.)", range=(0, 1.2), ticks=[0, 0.4, 0.8, 1.2], format=".1f", minor_ticks=[0.2, 0.6, 1.0], tick_direction= in, grid= both), style=style)left.line(x=[0, 1, 2, 3, 4, 5, 6, 7, 8, 9, 10], y=[0.1, 0.2, 0.38, 0.67, 0.95, 0.79, 0.51, 0.33, 0.23, 0.18, 0.15], label="Fit")left.scatter(x=[0, 2, 4, 6, 8, 10], y=[0.12, 0.36, 0.98, 0.49, 0.25, 0.14], color="#D55E00", marker_size=3 pt, label="Measured")left.legend(position=(0 mm, -9 mm), columns=2, font_size=7 pt, background="none")a = page.add(left, anchor= plot_top_left, offset=(20 mm, 26 mm)) right = plot(size=(87 mm, 82 mm), plot_area=box(offset=(17 mm, 18 mm), size=(64 mm, 45 mm)), frame= box, x=axis(label="Cycle count", scale= log, range=(1, 100), ticks=[1, 10, 100], format=".0f", minor_ticks=[2, 3, 4, 5, 6, 7, 8, 9, 20, 30, 40, 50, 60, 70, 80, 90], tick_direction= in, grid= both), y=axis(label="Response (%)", range=(0, 100), ticks=[0, 25, 50, 75, 100], format=".0f", tick_direction= in, grid= major), style=style)right.line(x=[1, 2, 5, 10, 20, 50, 100], y=[94, 88, 74, 62, 51, 36, 25], label="Run A")right.line(x=[1, 2, 5, 10, 20, 50, 100], y=[90, 80, 66, 55, 41, 26, 17], line_dash=[3 pt, 2 pt], label="Run B")right.legend(position=(0 mm, -9 mm), columns=2, font_size=7 pt, background="none")b = page.add(right, anchor= plot_top_left, offset=(115 mm, 26 mm)) page.add(text(content="(a) Linear axes", font_family="DejaVu Sans", font_size=9 pt), target=a.plot_top_left, offset=(0 mm, -20 mm))page.add(text(content="(b) Logarithmic axis", font_family="DejaVu Sans", font_size=9 pt), target=b.plot_top_left, offset=(0 mm, -20 mm))预览
依赖文件
examples/plot/publication.lay
常见错误与限制#
plot_area 与 margins 互斥。内容不会自动扩大页面;放不下的图例或标签产生布局警告。直接调整图表框与缩放外层 group 的语义不同。
逐项功能说明#
box#
建立矩形区域配置,供 plot_area 或 crop 使用。box 自身不绘制;单位由使用场景决定,crop 为 0–1 归一化坐标。
返回:box
必需输入:size.
plot#
创建固定物理尺寸的原生图表,用图层方法添加数据。x、y 设置坐标轴,plot_area 固定绘图区;通过 add 将整个图表放入页面。
返回:可添加数据图层并放入页面的图表。
必需输入:size.
plot_style#
定义可共享的图表、图层与装饰默认样式。显式调用参数优先于此配置;它不是 inline/display 字符串选项。
返回:plot_style
详细行为与补充示例#
参数#
| 参数 | 用途 | 默认或要求 |
|---|---|---|
size |
图表外框 | 显式物理尺寸 |
plot_area |
数据区 x/y/宽/高 | 可选;与 margins 互斥 |
常见用法#
尺寸分为三层:canvas(size=...) 定义整页,plot(size=...) 定义图表外框,plot_area 或 margins 定义内部数据区域。内容不会自动撑大页面或外框。
plot_area=box(offset=(左,上), size=(宽,高)) 使用物理长度,相对于图表外框。左、上非负,宽、高为正。它与 margins=(左,上,右,下) 互斥;两者均省略时才测量文字并自动分配留白。
覆盖图表实例的 size=(width, height) 时,显式 plot_area 的位置与尺寸保持固定,只改变外围空间;margins 固定四边留白,数据区会随外框改变。修改标签、图例和色标不会压缩固定数据区;空间不足会发出 W_PLOT_LAYOUT 并继续输出。
图表首次放置后封存,不能继续添加图层或装饰,但可以再次放置。直接改变图表外框保持文字、线宽和标记的物理尺寸;把图表放入组后缩放组,会缩放所有子内容。
本页示例的两个绘图区均为 64 × 45 mm,左上角由源码明确放在页面 (20,26) mm 和 (115,26) mm。使用绘图区锚点手动对齐面板;LayMesh 不自动等宽化或移动相邻面板。
坐标轴与刻度、图例与共享色标和数据标注分别说明各自的装饰与定位规则。