 LayMesh
Geometry Members
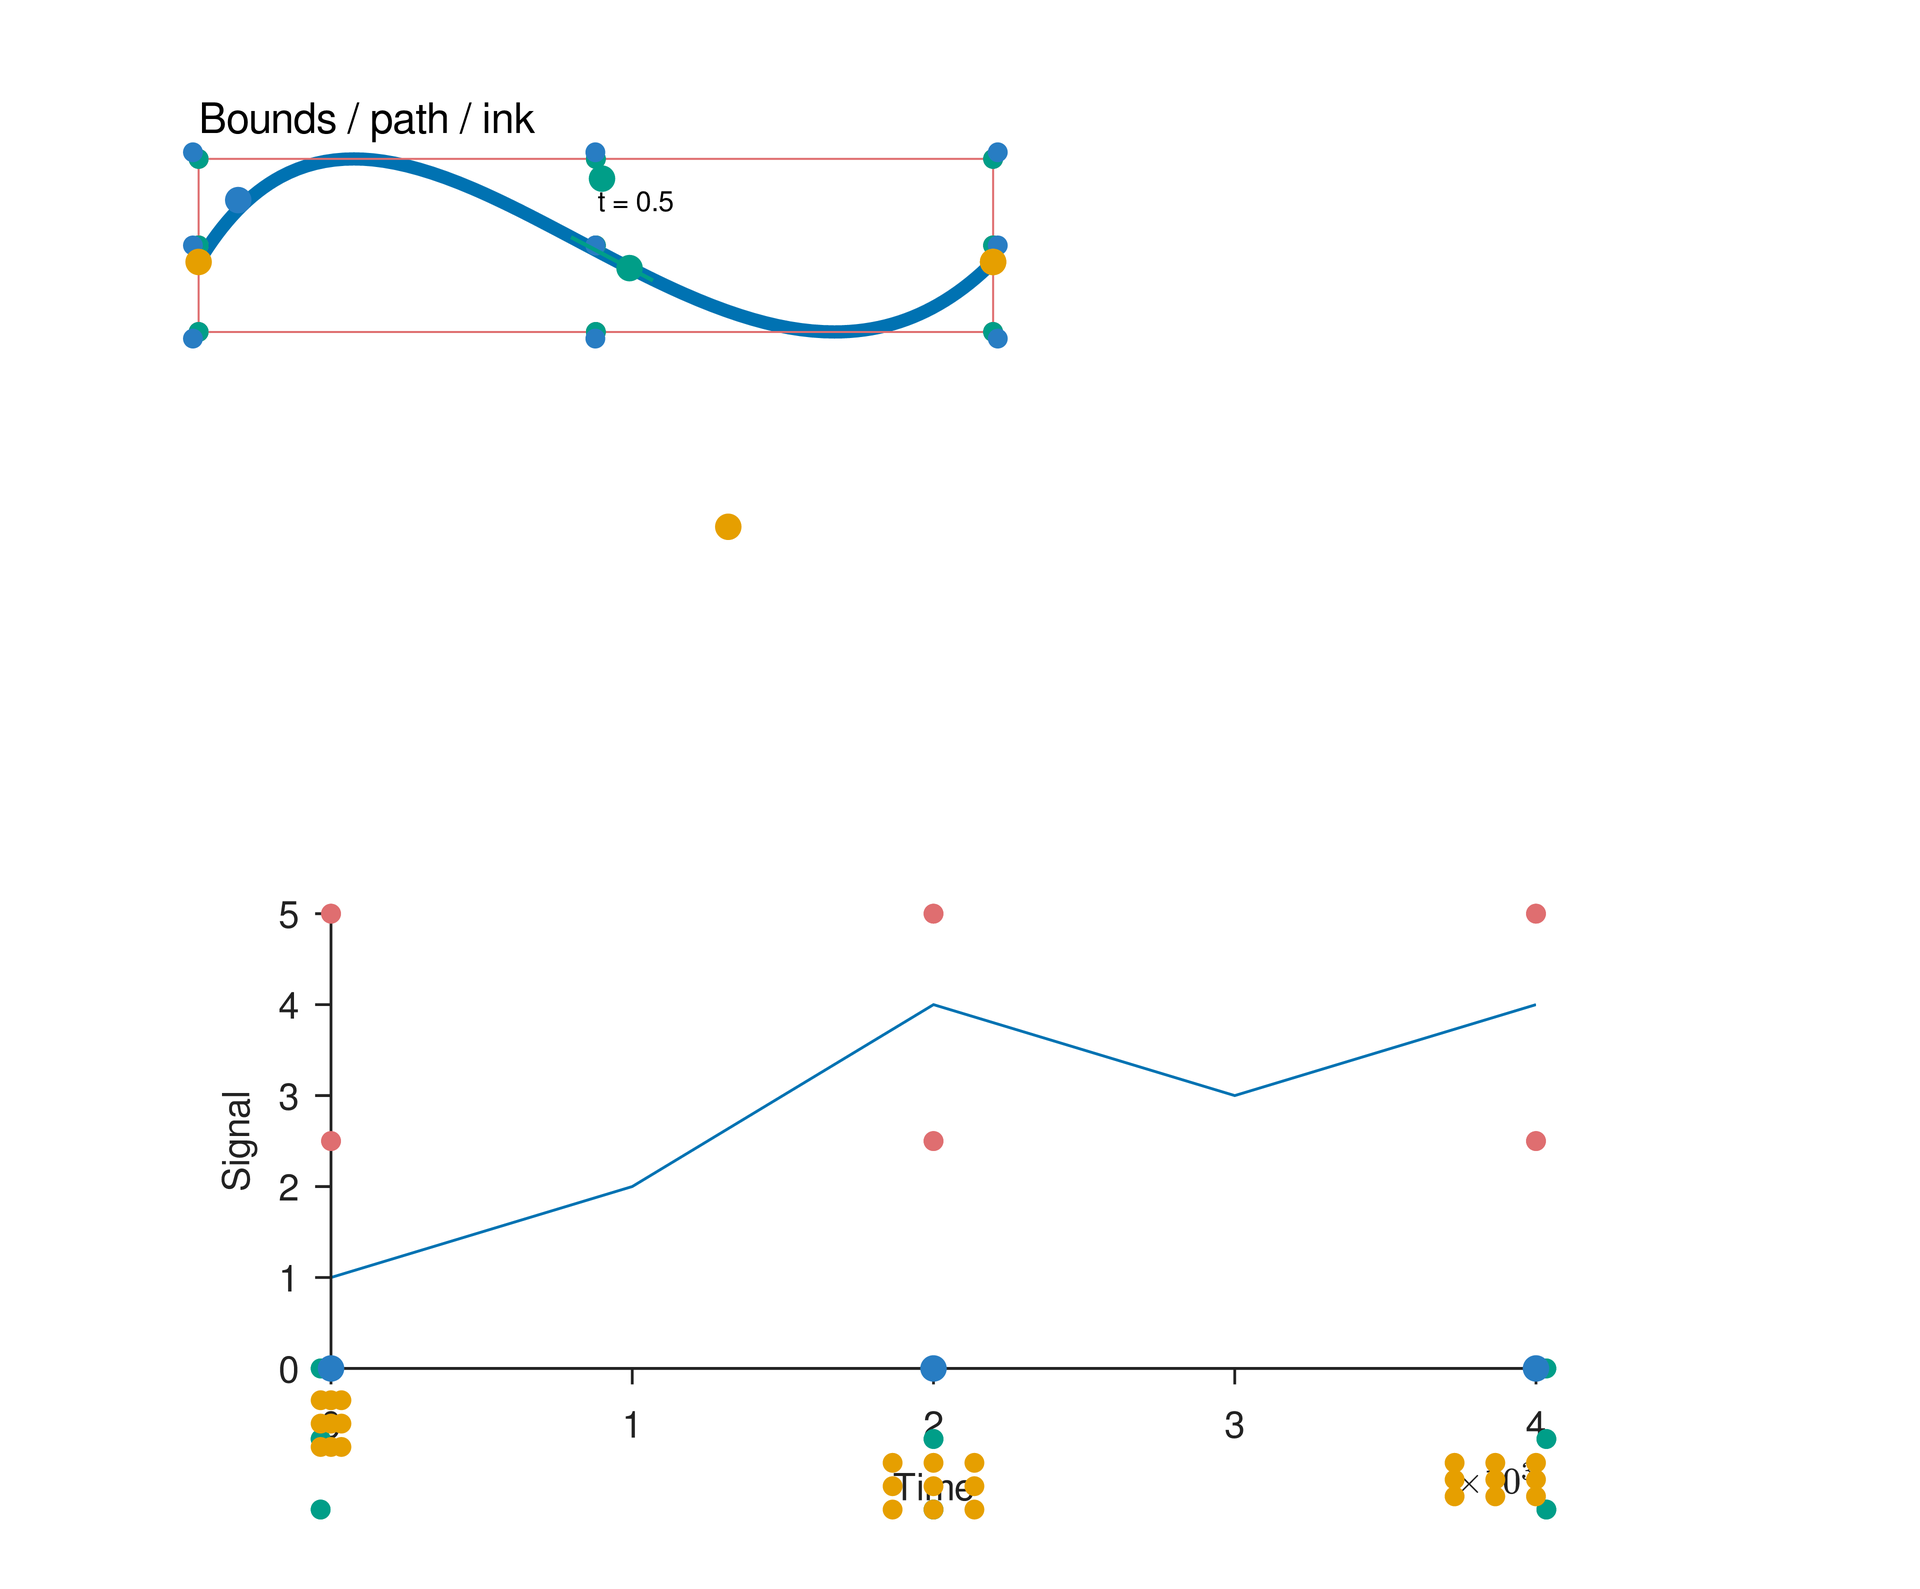
# Views retain their own meaning even though they share the nine-point API.page=canvas(size=(145mm,120mm),background="#ffffff")function mark_frame(view,color) { for location in [view.top_left,view.top_center,view.top_right, view.middle_left,view.center,view.middle_right, view.bottom_left,view.bottom_center,view.bottom_right] { page.add(ellipse(size=(1.5mm,1.5mm),fill=color),anchor=center,target=location) }}curve=page.add(path(commands=[move_to(0mm,20mm), cubic_to(15mm,-5mm,40mm,40mm,60mm,20mm)], border_color="#0072b2",border_width=1mm),offset=(15mm,12mm))marked=mark_frame(curve,"#df6e70")layout=curve.bounds# Views retain their own meaning even though they share the nine-point API.page=canvas(size=(145mm,120mm),background="#ffffff")function mark_frame(view,color) { for location in [view.top_left,view.top_center,view.top_right, view.middle_left,view.center,view.middle_right, view.bottom_left,view.bottom_center,view.bottom_right] { page.add(ellipse(size=(1.5mm,1.5mm),fill=color),anchor=center,target=location) }}curve=page.add(path(commands=[move_to(0mm,20mm), cubic_to(15mm,-5mm,40mm,40mm,60mm,20mm)], border_color="#0072b2",border_width=1mm),offset=(15mm,12mm))marked=mark_frame(curve,"#df6e70")layout=curve.boundsmarked=mark_frame(layout,"#df6e70")page.add(rect(size=(layout.width,layout.height),border_color="#df6e70", border_width=0.15mm),target=layout.top_left)marked=mark_frame(curve.path,"#009e88")marked=mark_frame(curve.path.bounds,"#009e88")painted=curve.inkmarked=mark_frame(painted.bounds,"#287dc3")boundary=painted.boundarypage.add(ellipse(size=(2mm,2mm),fill="#287dc3"),anchor=center, target=boundary.nearest(to=layout.top_left)[0]) # List indices refer to original subpaths, segments, nodes and controls.route=curve.path.subpaths[0]same_route=route.pathsegment=route.segments[0]node=route.nodes[1]control=segment.controls[0]all_controls=segment.controlsfor location in [route.start,route.end,node,control,all_controls[1]] { page.add(ellipse(size=(2mm,2mm),fill="#e69f00"),anchor=center,target=location)}point=segment.at(t=0.5)coordinate=(point.x,point.y)page.add(text("t = 0.5",font_size=6pt),offset=(coordinate[0]+2mm,coordinate[1]-4mm))direction=point.tangentleft_normal=point.normalpage.add(line(length=7mm,line_color="#009e88"),anchor=self.path.start, target=point,rotation=point.tangent_angle)page.add(ellipse(size=(2mm,2mm),fill="#009e88"),anchor=center, target=point,offset=(left_normal[0]*5mm,left_normal[1]*5mm))page.add(ellipse(size=(2mm,2mm),fill="#009e88"),anchor=center, target=point,offset=(direction[0]*5mm,direction[1]*5mm))box_point=layout.top_leftpage.add(text("Bounds / path / ink",font_size=9pt), offset=(box_point.x,box_point.y-5mm)) # Plot areas, complete axes, labels, ticks and exponent labels are components.p=plot(size=(105mm,50mm),x=axis(range=(0,4000),notation=offset, exponent=3,label="Time"),y=axis(range=(0,5),label="Signal"))p.line(x=[0,1000,2000,3000,4000],y=[1,2,4,3,4])chart=page.add(p,offset=(15mm,65mm))area=chart.plot_areamarked=mark_frame(area,"#df6e70")marked=mark_frame(area.bounds,"#df6e70")axes=chart.axeshorizontal=axes["x"]marked=mark_frame(horizontal,"#009e88")marked=mark_frame(horizontal.bounds,"#009e88")marked=mark_frame(horizontal.label,"#e69f00")marked=mark_frame(horizontal.exponent,"#e69f00")tick=horizontal.ticks[0]marked=mark_frame(tick,"#e69f00")for location in [horizontal.min,horizontal.max, horizontal.spine.path.at(fraction=0.5)] { page.add(ellipse(size=(2mm,2mm),fill="#287dc3"),anchor=center,target=location)}预览
背景
依赖文件
examples/manual/geometry-members.lay
复现
laymesh validate examples/manual/geometry-members.laylaymesh render examples/manual/geometry-members.lay -o figure.svglaymesh render examples/manual/geometry-members.lay -o figure.pdflaymesh render examples/manual/geometry-members.lay -o figure.png --dpi 300