 LayMesh
极坐标热图与周期等高线
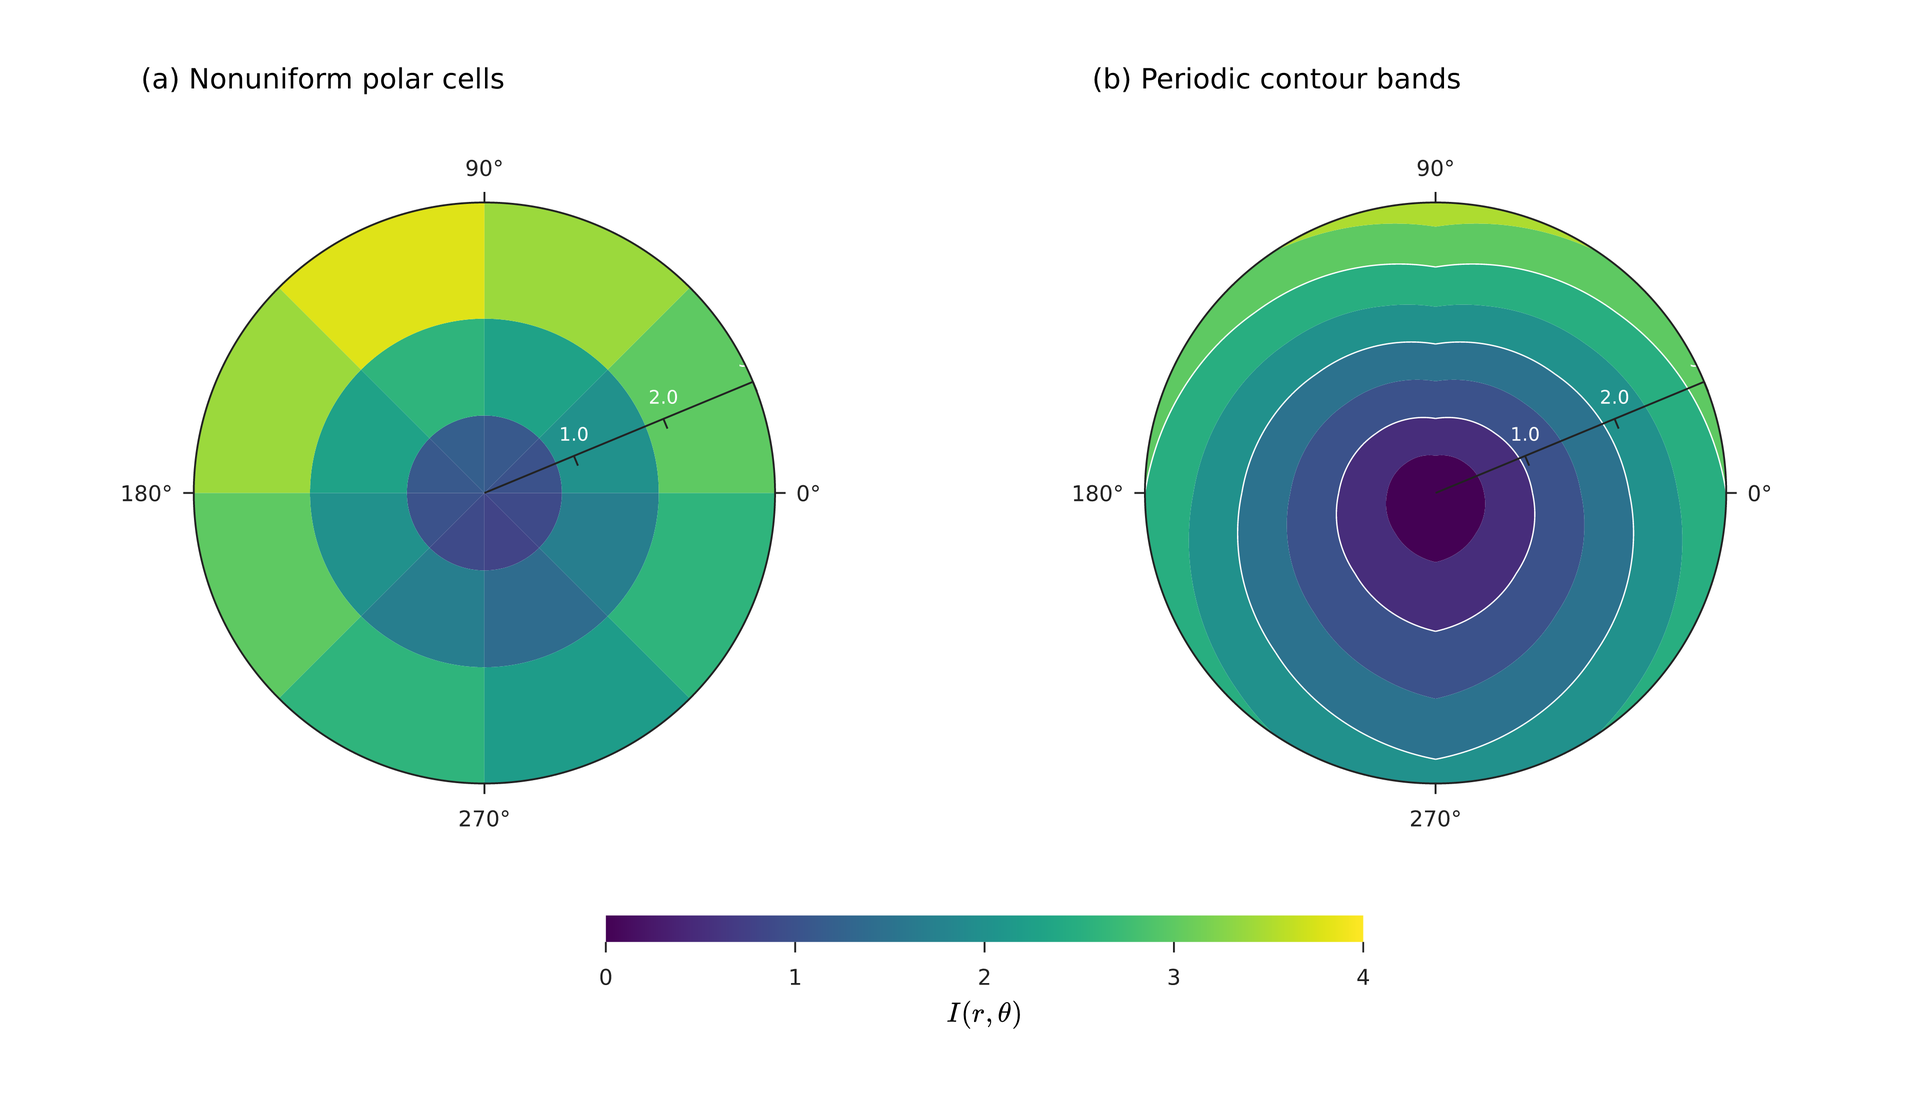
page=canvas(size=(218 mm,127 mm),background="#ffffff")s=plot_style(font_family="DejaVu Sans",font_size=7 pt)colors=color_scale(vmin=0,vmax=4,cmap="viridis")p=plot(projection= polar,size=(102 mm,102 mm),plot_area=box(offset=(18 mm, 20 mm), size=(66 mm, 66 mm)),style=s, theta=axis(ticks=[0,90,180,270]),r=axis(range=(0,3),ticks=[1,2,3],tick_color="#ffffff",tick_font_size=6 pt))p.heatmap(z=[[1,1.1,1.2,1.1,1,0.9,0.8,0.9],[2,2.3,2.6,2.3,2,1.7,1.4,1.7],[3,3.4,3.8,3.4,3,2.6,2.2,2.6]],theta_edges=[0,45,90,135,180,225,270,315,360],r_edges=[0,0.8,1.8,3],color_scale=colors)a=page.add(p,offset=(4 mm,3 mm))page.add(text(content="(a) Nonuniform polar cells",font_family="DejaVu Sans",font_size=9 pt),target=a.plot_top_left,offset=(-6 mm,-16 mm))q=plot(projection= polar,size=(102 mm,102 mm),plot_area=box(offset=(18 mm, 20 mm), size=(66 mm, 66 mm)),style=s, theta=axis(ticks=[0,90,180,270]),r=axis(range=(0,3),ticks=[1,2,3],tick_color="#ffffff",tick_font_size=6 pt))z=[[0,0,0,0,0,0,0,0],[1,1.15,1.3,1.15,1,0.85,0.7,0.85],[2,2.3,2.6,2.3,2,1.7,1.4,1.7],[3,3.4,3.8,3.4,3,2.6,2.2,2.6]]q.contourf(z=z,theta=[0,45,90,135,180,225,270,315],r=[0,1,2,3],levels=[0,0.5,1,1.5,2,2.5,3,3.5],periodic=true,color_scale=colors)q.contour(z=z,theta=[0,45,90,135,180,225,270,315],r=[0,1,2,3],levels=[1,2,3],periodic=true,color="#ffffff",line_width=0.15 mm)b=page.add(q,offset=(112 mm,3 mm))page.add(text(content="(b) Periodic contour bands",font_family="DejaVu Sans",font_size=9 pt),target=b.plot_top_left,offset=(-6 mm,-16 mm))page.add(colorbar(scale=colors,orientation= horizontal,length=86 mm,thickness=3 mm,ticks=[0,1,2,3,4],label=formula(source=r"I(r,\theta)",font_size=9 pt),style=s),offset=(68 mm,104 mm))# BEGIN DEMOpage=canvas(size=(218 mm,127 mm),background="#ffffff")s=plot_style(font_family="DejaVu Sans",font_size=7 pt)colors=color_scale(vmin=0,vmax=4,cmap="viridis")p=plot(projection= polar,size=(102 mm,102 mm),plot_area=box(offset=(18 mm, 20 mm), size=(66 mm, 66 mm)),style=s, theta=axis(ticks=[0,90,180,270]),r=axis(range=(0,3),ticks=[1,2,3],tick_color="#ffffff",tick_font_size=6 pt))p.heatmap(z=[[1,1.1,1.2,1.1,1,0.9,0.8,0.9],[2,2.3,2.6,2.3,2,1.7,1.4,1.7],[3,3.4,3.8,3.4,3,2.6,2.2,2.6]],theta_edges=[0,45,90,135,180,225,270,315,360],r_edges=[0,0.8,1.8,3],color_scale=colors)a=page.add(p,offset=(4 mm,3 mm))page.add(text(content="(a) Nonuniform polar cells",font_family="DejaVu Sans",font_size=9 pt),target=a.plot_top_left,offset=(-6 mm,-16 mm))q=plot(projection= polar,size=(102 mm,102 mm),plot_area=box(offset=(18 mm, 20 mm), size=(66 mm, 66 mm)),style=s, theta=axis(ticks=[0,90,180,270]),r=axis(range=(0,3),ticks=[1,2,3],tick_color="#ffffff",tick_font_size=6 pt))z=[[0,0,0,0,0,0,0,0],[1,1.15,1.3,1.15,1,0.85,0.7,0.85],[2,2.3,2.6,2.3,2,1.7,1.4,1.7],[3,3.4,3.8,3.4,3,2.6,2.2,2.6]]q.contourf(z=z,theta=[0,45,90,135,180,225,270,315],r=[0,1,2,3],levels=[0,0.5,1,1.5,2,2.5,3,3.5],periodic=true,color_scale=colors)q.contour(z=z,theta=[0,45,90,135,180,225,270,315],r=[0,1,2,3],levels=[1,2,3],periodic=true,color="#ffffff",line_width=0.15 mm)b=page.add(q,offset=(112 mm,3 mm))page.add(text(content="(b) Periodic contour bands",font_family="DejaVu Sans",font_size=9 pt),target=b.plot_top_left,offset=(-6 mm,-16 mm))page.add(colorbar(scale=colors,orientation= horizontal,length=86 mm,thickness=3 mm,ticks=[0,1,2,3,4],label=formula(source=r"I(r,\theta)",font_size=9 pt),style=s),offset=(68 mm,104 mm))# END DEMO预览
背景
依赖文件
examples/plot/polar-field.lay
复现
laymesh validate examples/plot/polar-field.laylaymesh render examples/plot/polar-field.lay -o figure.svglaymesh render examples/plot/polar-field.lay -o figure.pdflaymesh render examples/plot/polar-field.lay -o figure.png --dpi 300