 LayMesh
Plot area and physical size#
Purpose and concepts#
Page size, chart size and plot-area size are three distinct dimensions. plot_area=box(...) fixes the data region’s physical position and dimensions, useful for comparable experimental panels.
Minimal complete example#
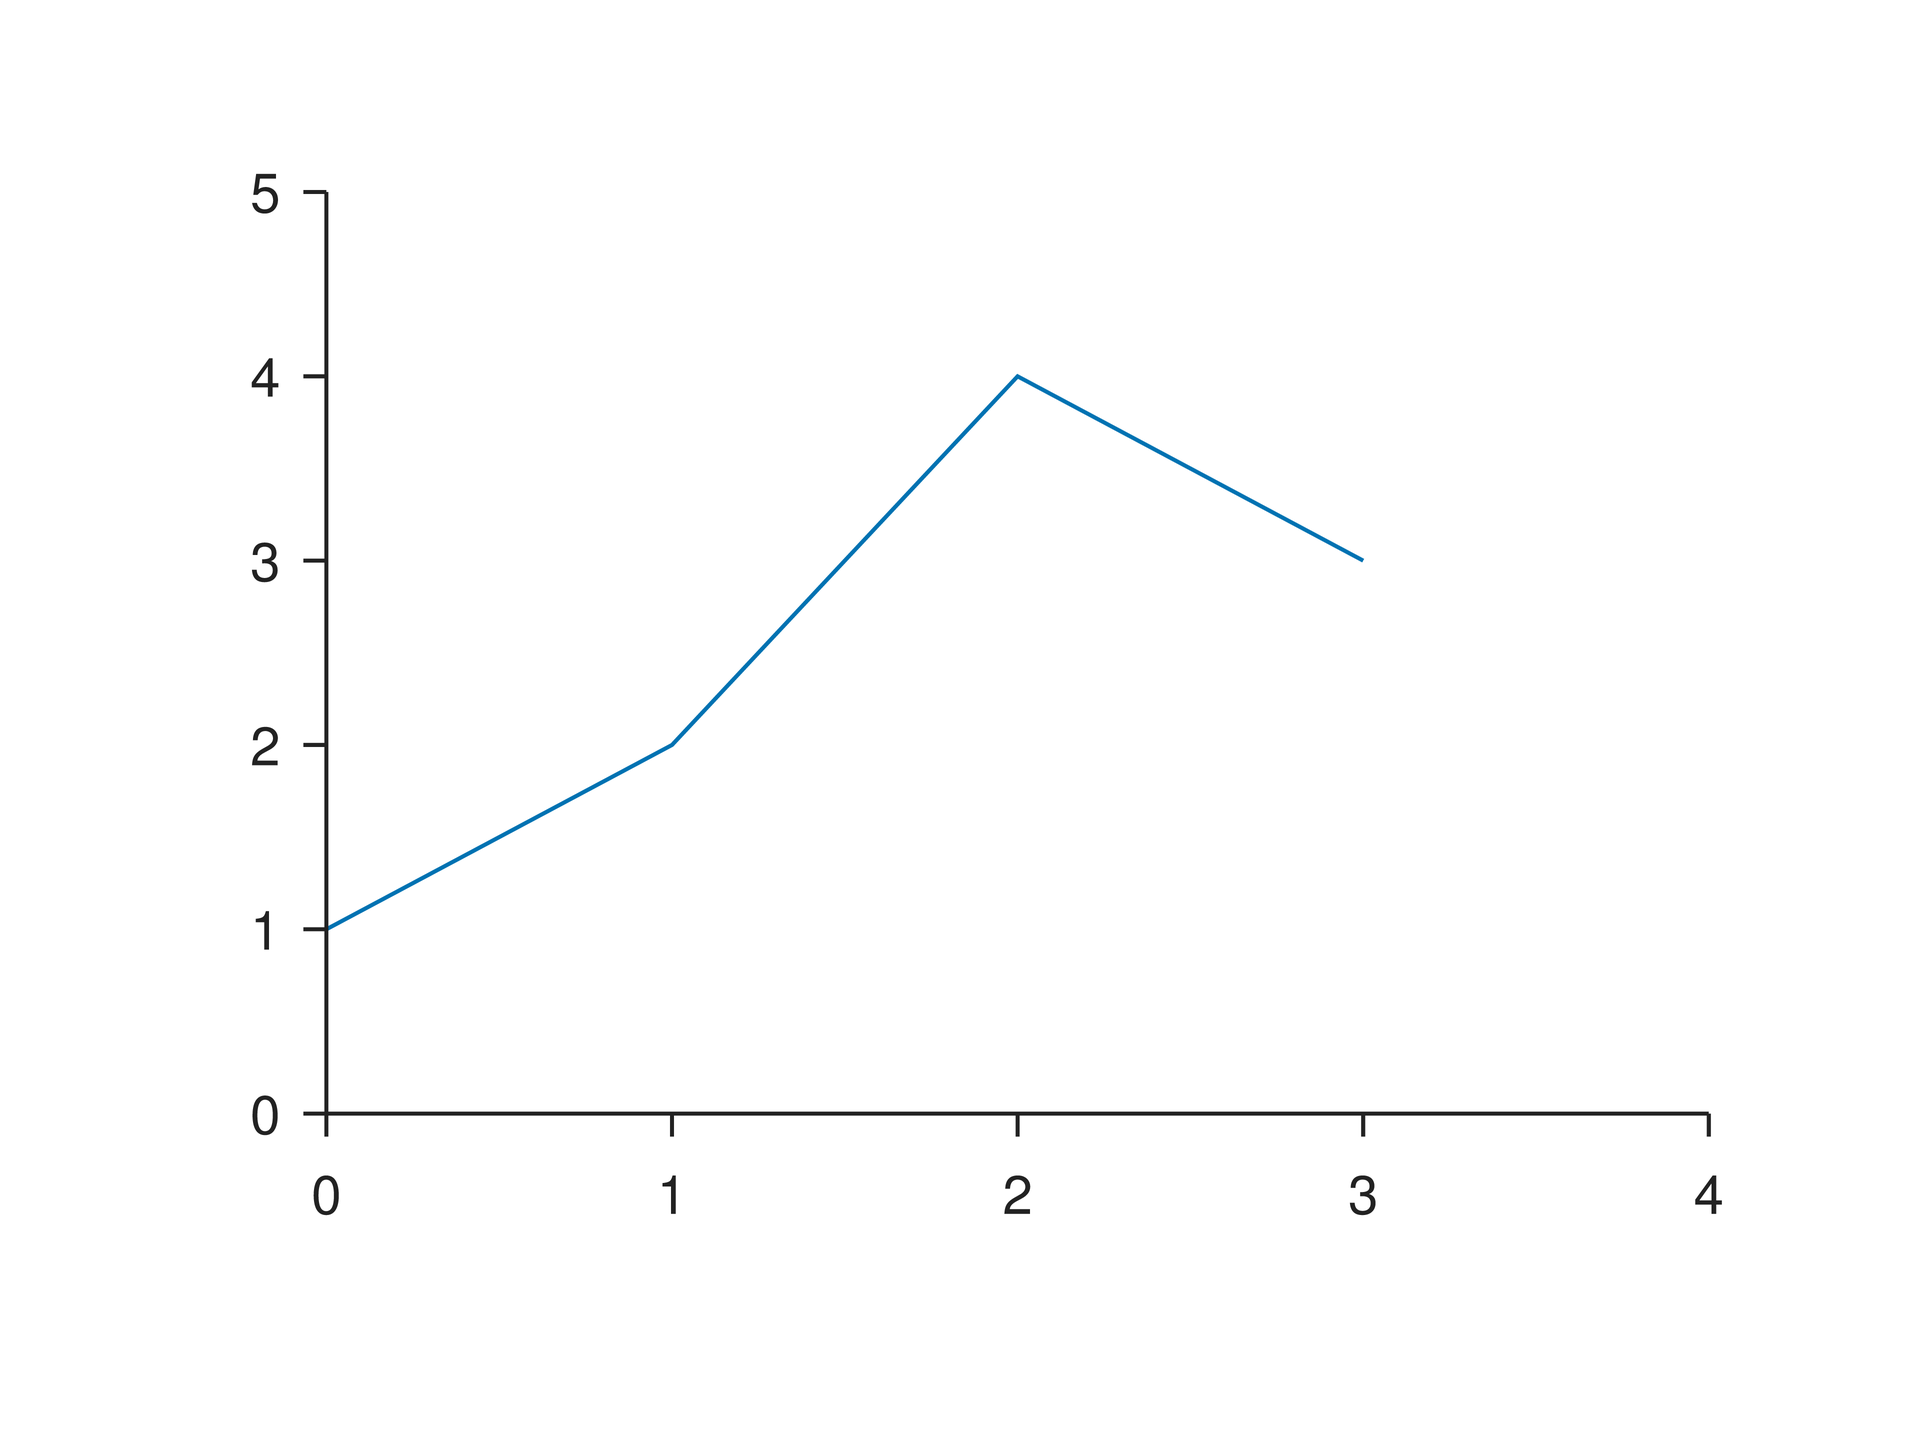
Run this file directly with laymesh validate or laymesh render; it contains its own canvas and required definitions.
# Minimal complete example: plotpage=canvas(size=(100mm,75mm),background="#ffffff")p=plot(size=(86mm,62mm),x=axis(range=(0,4)),y=axis(range=(0,5)))p.line(x=[0,1,2,3],y=[1,2,4,3],label="Signal")page.add(p,offset=(7mm,6mm))# Minimal complete example: plotpage=canvas(size=(100mm,75mm),background="#ffffff")p=plot(size=(86mm,62mm),x=axis(range=(0,4)),y=axis(range=(0,5)))p.line(x=[0,1,2,3],y=[1,2,4,3],label="Signal")page.add(p,offset=(7mm,6mm))Preview
Dependencies
examples/manual/plot.lay
Parameters and default behavior#
Unitless geometry uses the canvas unit; unitless type and stroke sizes use pt. Explicit call parameters override inherited/theme defaults. The linked interface reference lists accepted types, choices and defaults per parameter.
Composition#
An explicit plot_area retains the data region during chart reflow. margins retain edge spacing while the data area follows the frame. Shared plot_style sets text/stroke defaults; explicit layer parameters win.
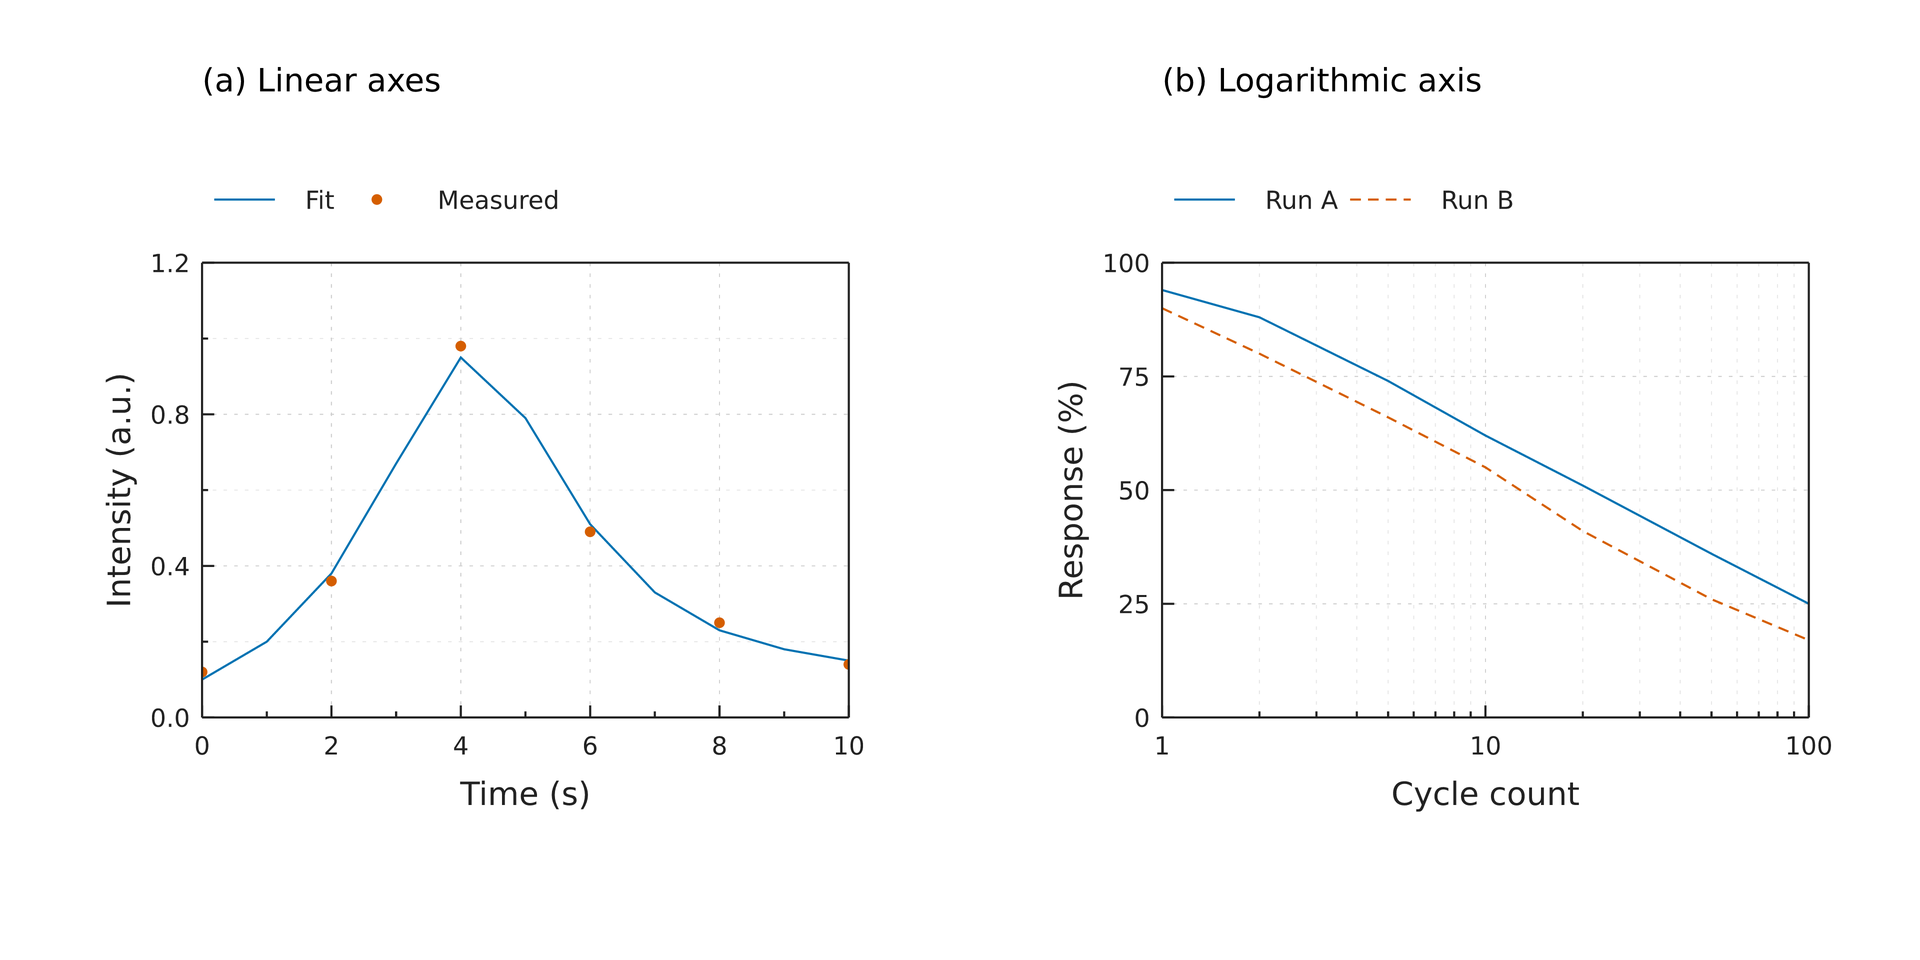
# Each data rectangle is explicitly 64 x 45 mm. Placement uses data-area anchors.# Changing ticks, label sizes or legends never aligns or resizes the other panel.page = canvas(size=(190 mm, 95 mm), background="#ffffff")style = plot_style(font_family="DejaVu Sans", font_size=8 pt, tick_font_size=7 pt, label_font_size=9 pt, grid_color="#d0d0d0", grid_line_width=0.3 pt, grid_line_dash=[1 pt, 2 pt]) left = plot(size=(87 mm, 82 mm), plot_area=box(offset=(17 mm, 18 mm), size=(64 mm, 45 mm)), frame= box, x=axis(label="Time (s)", range=(0, 10), ticks=[0, 2, 4, 6, 8, 10], minor_ticks=[1, 3, 5, 7, 9], tick_direction= in, grid= major), y=axis(label="Intensity (a.u.)", range=(0, 1.2), ticks=[0, 0.4, 0.8, 1.2], format=".1f", minor_ticks=[0.2, 0.6, 1.0], tick_direction= in, grid= both), style=style)left.line(x=[0, 1, 2, 3, 4, 5, 6, 7, 8, 9, 10], y=[0.1, 0.2, 0.38, 0.67, 0.95, 0.79, 0.51, 0.33, 0.23, 0.18, 0.15], label="Fit")# Each data rectangle is explicitly 64 x 45 mm. Placement uses data-area anchors.# Changing ticks, label sizes or legends never aligns or resizes the other panel.page = canvas(size=(190 mm, 95 mm), background="#ffffff")style = plot_style(font_family="DejaVu Sans", font_size=8 pt, tick_font_size=7 pt, label_font_size=9 pt, grid_color="#d0d0d0", grid_line_width=0.3 pt, grid_line_dash=[1 pt, 2 pt]) left = plot(size=(87 mm, 82 mm), plot_area=box(offset=(17 mm, 18 mm), size=(64 mm, 45 mm)), frame= box, x=axis(label="Time (s)", range=(0, 10), ticks=[0, 2, 4, 6, 8, 10], minor_ticks=[1, 3, 5, 7, 9], tick_direction= in, grid= major), y=axis(label="Intensity (a.u.)", range=(0, 1.2), ticks=[0, 0.4, 0.8, 1.2], format=".1f", minor_ticks=[0.2, 0.6, 1.0], tick_direction= in, grid= both), style=style)left.line(x=[0, 1, 2, 3, 4, 5, 6, 7, 8, 9, 10], y=[0.1, 0.2, 0.38, 0.67, 0.95, 0.79, 0.51, 0.33, 0.23, 0.18, 0.15], label="Fit")left.scatter(x=[0, 2, 4, 6, 8, 10], y=[0.12, 0.36, 0.98, 0.49, 0.25, 0.14], color="#D55E00", marker_size=3 pt, label="Measured")left.legend(position=(0 mm, -9 mm), columns=2, font_size=7 pt, background="none")a = page.add(left, anchor= plot_top_left, offset=(20 mm, 26 mm)) right = plot(size=(87 mm, 82 mm), plot_area=box(offset=(17 mm, 18 mm), size=(64 mm, 45 mm)), frame= box, x=axis(label="Cycle count", scale= log, range=(1, 100), ticks=[1, 10, 100], format=".0f", minor_ticks=[2, 3, 4, 5, 6, 7, 8, 9, 20, 30, 40, 50, 60, 70, 80, 90], tick_direction= in, grid= both), y=axis(label="Response (%)", range=(0, 100), ticks=[0, 25, 50, 75, 100], format=".0f", tick_direction= in, grid= major), style=style)right.line(x=[1, 2, 5, 10, 20, 50, 100], y=[94, 88, 74, 62, 51, 36, 25], label="Run A")right.line(x=[1, 2, 5, 10, 20, 50, 100], y=[90, 80, 66, 55, 41, 26, 17], line_dash=[3 pt, 2 pt], label="Run B")right.legend(position=(0 mm, -9 mm), columns=2, font_size=7 pt, background="none")b = page.add(right, anchor= plot_top_left, offset=(115 mm, 26 mm)) page.add(text(content="(a) Linear axes", font_family="DejaVu Sans", font_size=9 pt), target=a.plot_top_left, offset=(0 mm, -20 mm))page.add(text(content="(b) Logarithmic axis", font_family="DejaVu Sans", font_size=9 pt), target=b.plot_top_left, offset=(0 mm, -20 mm))Preview
Dependencies
examples/plot/publication.lay
Common errors and limits#
plot_area and margins are exclusive. Content does not enlarge the page; cramped legends or labels generate layout warnings. Reflowing the chart frame differs from scaling an enclosing group.
Individual functions#
box#
Create a rectangular region configuration for plot_area or crop. box draws nothing by itself; units depend on use, with crop using normalized 0–1 coordinates.
Returns: box
Required inputs: size.
Minimal complete source · Composition source · All parameters
plot#
Create a native plot with physical dimensions and add data through layer methods. Configure axes with x and y, or fix the drawing area with plot_area. Place the plot on the page with add.
Returns: A plot accepting data layers and page placement.
Required inputs: size.
Minimal complete source · Composition source · All parameters
plot_style#
Define shared chart/layer/decoration style defaults. Explicit call parameters win; this is not an inline/display string option.
Returns: plot_style
Minimal complete source · Composition source · All parameters
Detailed behavior and further examples#
Parameters#
| Parameter | Purpose | Default or requirement |
|---|---|---|
size |
Outer chart size | Explicit physical size |
plot_area |
Data area x/y/width/height | Optional; exclusive with margins |
Common usage#
Size has three levels: canvas(size=...) defines the page, plot(size=...) defines the chart frame, and plot_area or margins defines the inner data region. Content does not automatically enlarge the page or frame.
plot_area=box(offset=(left,top), size=(width,height)) uses physical lengths relative to the chart frame. Left/top are nonnegative and width/height are positive. It is exclusive with margins=(left,top,right,bottom). Only when both are omitted does text measurement determine automatic margins.
Overriding a chart instance's size retains the position and size of explicit plot_area, changing surrounding space. Fixed margins instead retain the four margins while the data region follows the frame. Labels, legends and colorbars do not shrink a fixed data area; insufficient room produces W_PLOT_LAYOUT while preserving output.
The chart is sealed after first placement: it can be placed again, but cannot receive more layers or decorations. Changing a chart frame preserves physical text, stroke and marker sizes; scaling an enclosing group scales all children.
Both data areas in this example measure 64 × 45 mm. Source explicitly places their page top-left corners at (20,26) mm and (115,26) mm. Use plot-area anchors for manual panel alignment; LayMesh does not automatically equalize or move neighboring panels.
See axes and ticks, legends and shared colorbars, and annotations for their respective rules.
Limits and related topics#
Data input and missing values · Axes and ticks · Labels and scientific notation · Legends and shared colorbars · Data anchors and annotations