 LayMesh
Error bars and bands#
Purpose and concepts#
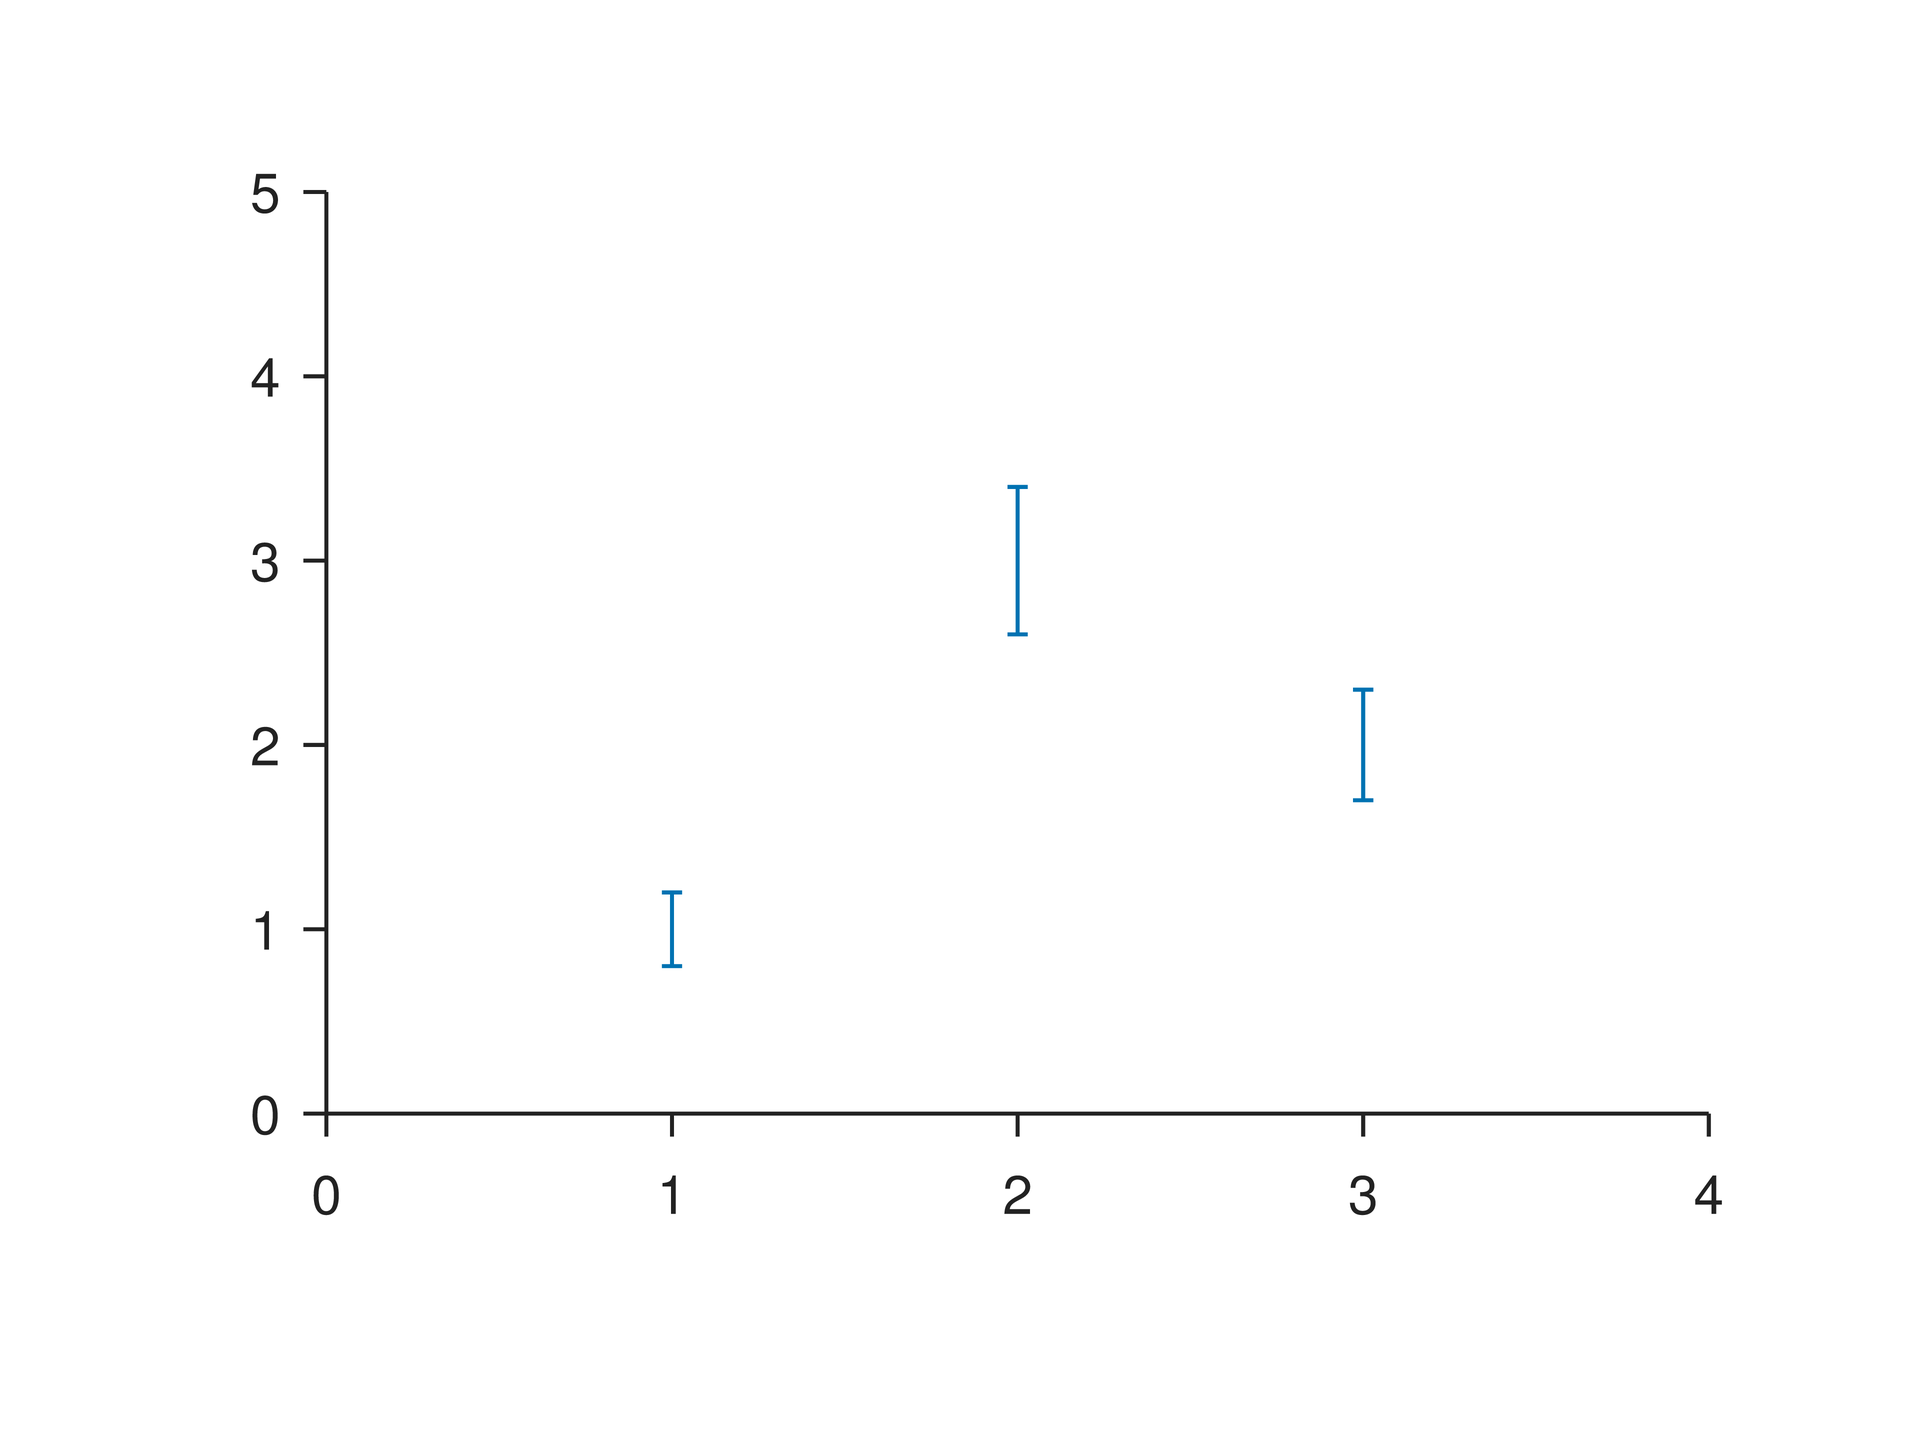
errorbar draws xerr/yerr at samples; band fills between lower/upper at x positions. Errors use data units, while cap_size and stroke width are physical lengths.
Minimal complete example#
Run this file directly with laymesh validate or laymesh render; it contains its own canvas and required definitions.
# Minimal complete example: plot.errorbarpage=canvas(size=(100mm,75mm),background="#ffffff")p=plot(size=(86mm,62mm),x=axis(range=(0,4)),y=axis(range=(0,5)))p.errorbar(x=[1,2,3],y=[1,3,2],yerr=[0.2,0.4,0.3])page.add(p,offset=(7mm,6mm))# Minimal complete example: plot.errorbarpage=canvas(size=(100mm,75mm),background="#ffffff")p=plot(size=(86mm,62mm),x=axis(range=(0,4)),y=axis(range=(0,5)))p.errorbar(x=[1,2,3],y=[1,3,2],yerr=[0.2,0.4,0.3])page.add(p,offset=(7mm,6mm))Preview
Dependencies
examples/manual/plot-errorbar.lay
Parameters and default behavior#
Unitless geometry uses the canvas unit; unitless type and stroke sizes use pt. Explicit call parameters override inherited/theme defaults. The linked interface reference lists accepted types, choices and defaults per parameter.
Composition#
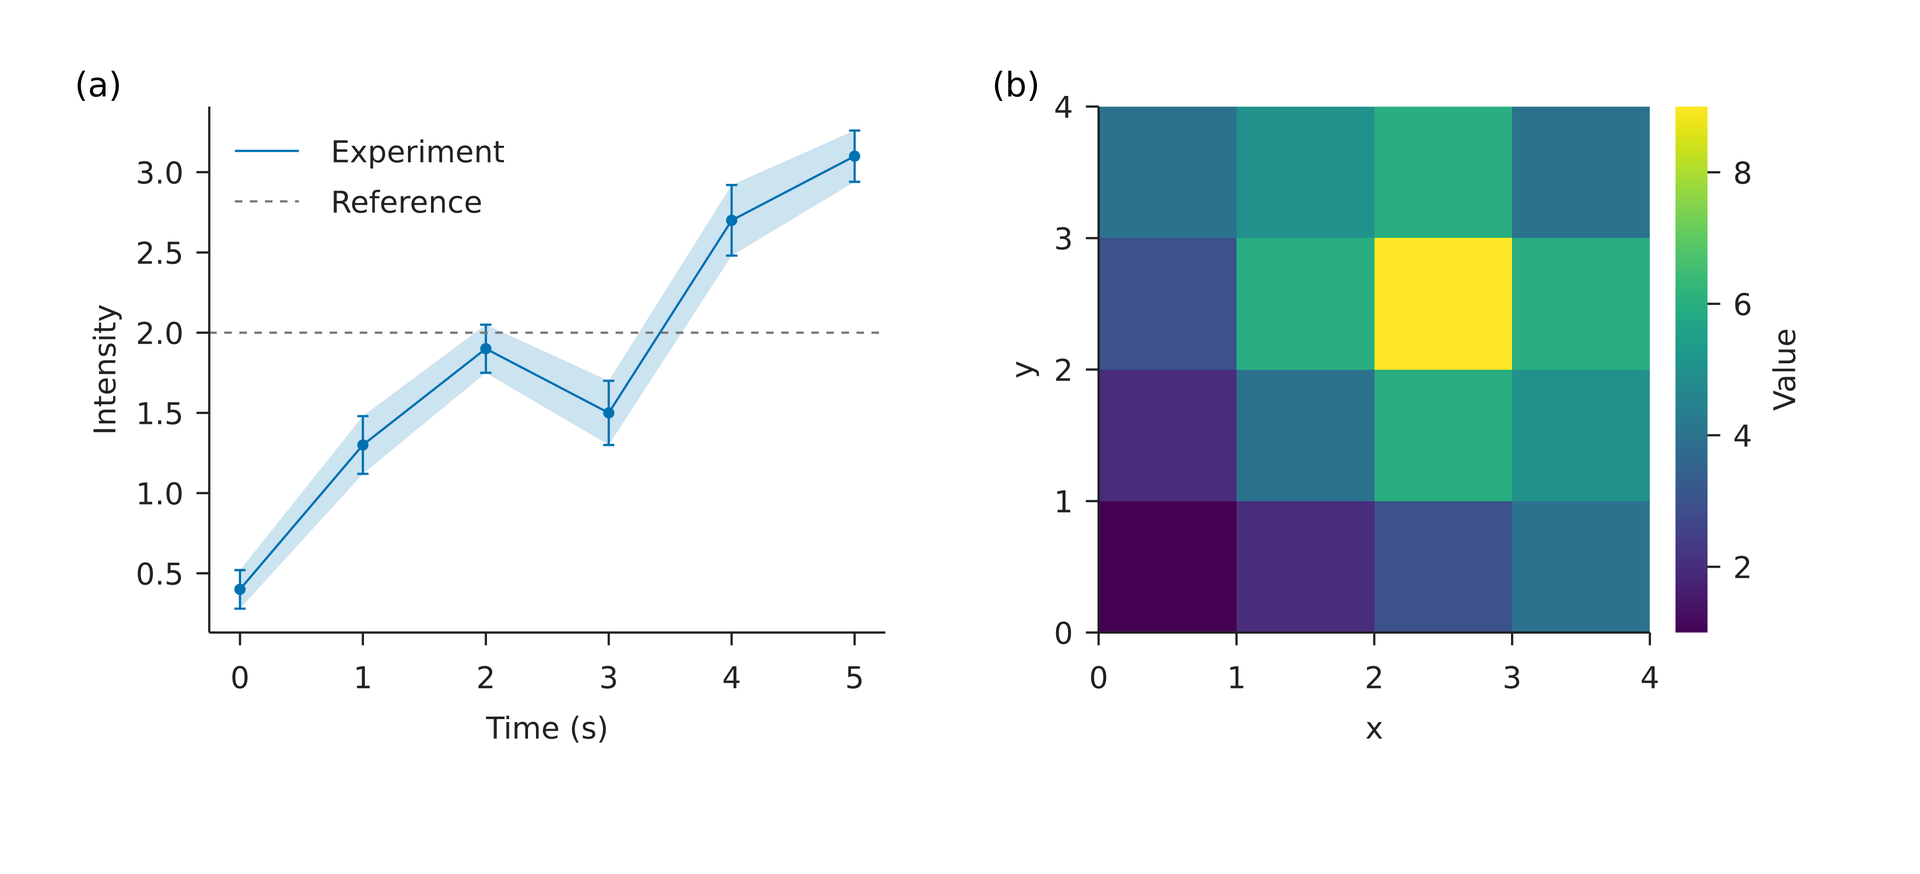
Combine a translucent band, central line and point errors for one experiment. Errors may be symmetric or separately specify lower/upper sides, with corresponding sample positions.
page = canvas(size=(180 mm, 82 mm), background="#ffffff")d = table(src="results.csv")style = plot_style(font_family="DejaVu Sans", font_size=8 pt, line_width=0.6 pt)p = plot(size=(80 mm, 65 mm), x=axis(label="Time (s)"), y=axis(label="Intensity"), style=style)p.band(x=d["time"], lower=d["lower"], upper=d["upper"], color="#0072B2")p.line(x=d["time"], y=d["signal"], color="#0072B2", label="Experiment")p.scatter(x=d["time"], y=d["signal"], color="#0072B2", marker_size=3 pt)p.errorbar(x=d["time"], y=d["signal"], yerr=d["error"], color="#0072B2")p.hline(y=2, color="#777777", line_dash=[2 pt, 2 pt], label="Reference")p.legend(position= top_left)left = page.add(p, target=page.top_left, offset=(7 mm, 6 mm))h = plot(size=(80 mm, 65 mm), x=axis(label="x"), y=axis(label="y"), style=style)heat = h.heatmap(z=[[1,2,3,4],[2,4,6,5],[3,6,9,6],[4,5,6,4]], extent=(0,4,0,4), origin= lower, cmap="viridis")h.colorbar(heat, label="Value")page = canvas(size=(180 mm, 82 mm), background="#ffffff")d = table(src="results.csv")style = plot_style(font_family="DejaVu Sans", font_size=8 pt, line_width=0.6 pt)p = plot(size=(80 mm, 65 mm), x=axis(label="Time (s)"), y=axis(label="Intensity"), style=style)p.band(x=d["time"], lower=d["lower"], upper=d["upper"], color="#0072B2")p.line(x=d["time"], y=d["signal"], color="#0072B2", label="Experiment")p.scatter(x=d["time"], y=d["signal"], color="#0072B2", marker_size=3 pt)p.errorbar(x=d["time"], y=d["signal"], yerr=d["error"], color="#0072B2")p.hline(y=2, color="#777777", line_dash=[2 pt, 2 pt], label="Reference")p.legend(position= top_left)left = page.add(p, target=page.top_left, offset=(7 mm, 6 mm))h = plot(size=(80 mm, 65 mm), x=axis(label="x"), y=axis(label="y"), style=style)heat = h.heatmap(z=[[1,2,3,4],[2,4,6,5],[3,6,9,6],[4,5,6,4]], extent=(0,4,0,4), origin= lower, cmap="viridis")h.colorbar(heat, label="Value")right = page.add(h, target=left.top_right, offset=(6 mm, 0 mm))page.add(text(content="(a)", font_family="DejaVu Sans", font_size=9 pt), target=left.top_left)page.add(text(content="(b)", font_family="DejaVu Sans", font_size=9 pt), target=right.top_left)time,signal,error,lower,upper0,0.4,0.12,0.28,0.521,1.3,0.18,1.12,1.482,1.9,0.15,1.75,2.053,1.5,0.20,1.30,1.704,2.7,0.22,2.48,2.925,3.1,0.16,2.94,3.26Preview
Dependencies
examples/plot/results.csvexamples/plot/scientific.lay
Common errors and limits#
Errors cannot be negative and arrays must match. Broken-axis/projection clipping does not invent error caps. Missing inputs retain diagnostics. Bounds are not error magnitudes.
Individual functions#
plot-errorbar#
Add error bars. xerr and yerr accept symmetric errors or separate lower and upper errors; cap_size sets the physical cap length.
Returns: A layer handle that can be included in a shared legend.
Minimal complete source · Composition source · All parameters
plot-band#
Filled band layer: add data to this plot, control its appearance with physical style parameters, and select data mappings with named-axis parameters.
Returns: A layer handle that can be included in a shared legend.
Minimal complete source · Composition source · All parameters
Detailed behavior and further examples#
Parameters#
| Parameter | Purpose | Default or requirement |
|---|---|---|
yerr / xerr |
Error ranges | Match observations |
lower / upper |
Band boundaries | Same length as x |
Common usage#
Error bars express uncertainty per observation; band uses lower/upper bounds for intervals. The left panel combines lines, points, bands, error bars and a reference line; the right panel shows a heatmap.
Limits and related topics#
Lines and scatter · Bars and steps · Heatmaps and contours · Multiple axes and breaks