 LayMesh
Data anchors and annotations#
Purpose and concepts#
Data anchors map original values into instance coordinates. chart.data(x=...,y=...) positions labels and connectors through axis transforms, instance rotation and group resizing. hline/vline draw references inside the data region.
Minimal complete example#
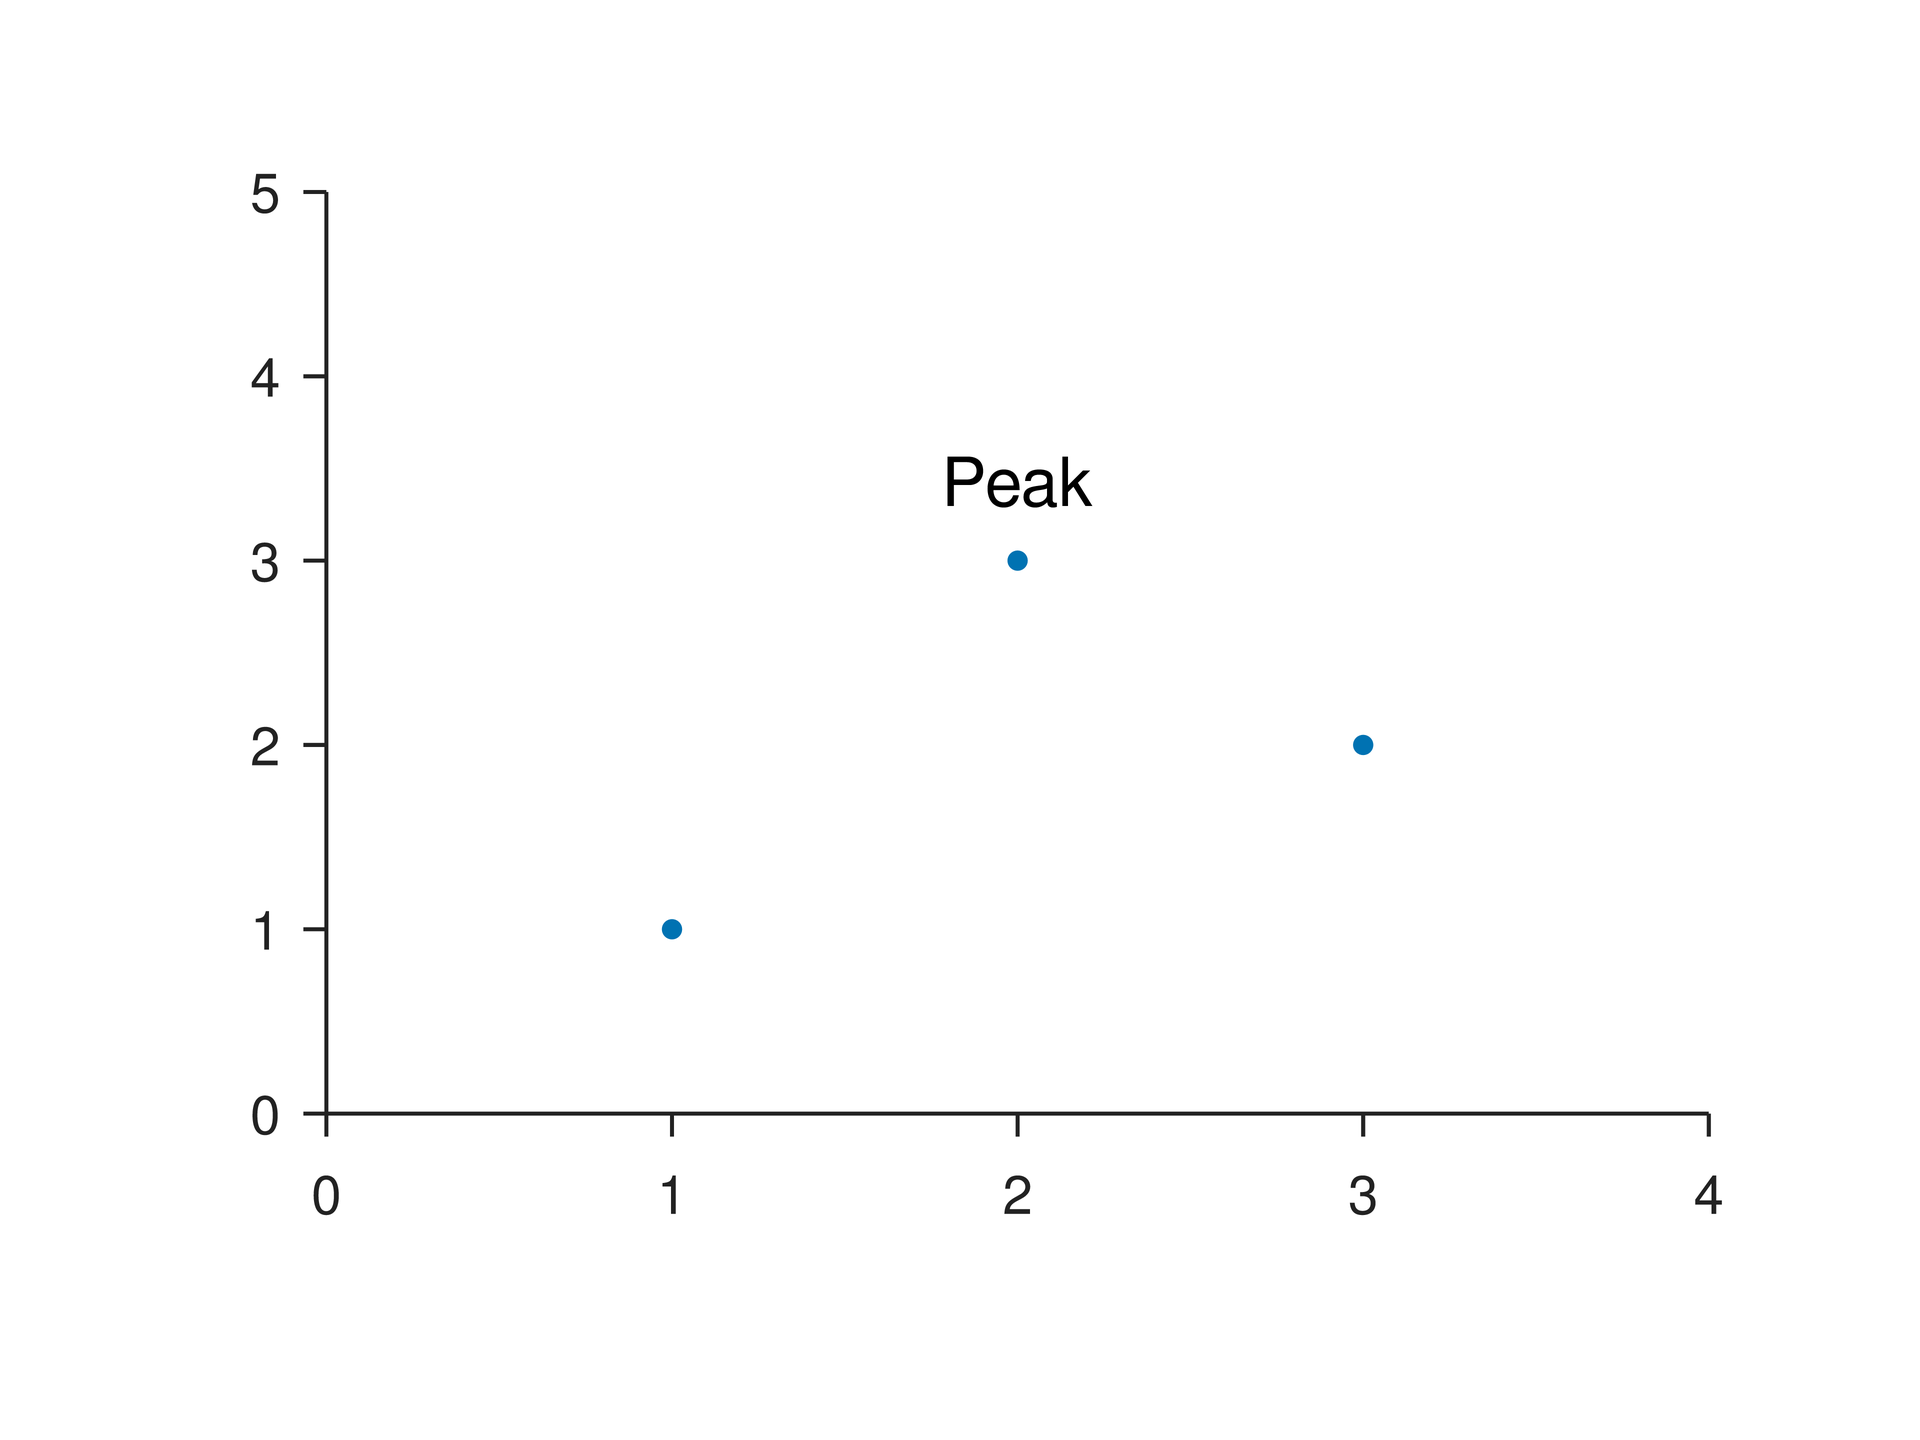
Run this file directly with laymesh validate or laymesh render; it contains its own canvas and required definitions.
# Minimal complete example: instance.datapage=canvas(size=(100mm,75mm),background="#ffffff")p=plot(size=(86mm,62mm),x=axis(range=(0,4)),y=axis(range=(0,5)))p.scatter(x=[1,2,3],y=[1,3,2])chart=page.add(p,offset=(7mm,6mm))page.add(text("Peak"),target=chart.data(x=2,y=3),anchor=bottom_center,offset=(0mm,-2mm))# Minimal complete example: instance.datapage=canvas(size=(100mm,75mm),background="#ffffff")p=plot(size=(86mm,62mm),x=axis(range=(0,4)),y=axis(range=(0,5)))p.scatter(x=[1,2,3],y=[1,3,2])chart=page.add(p,offset=(7mm,6mm))page.add(text("Peak"),target=chart.data(x=2,y=3),anchor=bottom_center,offset=(0mm,-2mm))Preview
Dependencies
examples/manual/instance-data.lay
Parameters and default behavior#
Unitless geometry uses the canvas unit; unitless type and stroke sizes use pt. Explicit call parameters override inherited/theme defaults. The linked interface reference lists accepted types, choices and defaults per parameter.
Composition#
Align a label’s bottom_center with a data point, then add a physical offset. Named-axis anchors accept x_axis/y_axis, keeping secondary-axis curves and annotations consistent.
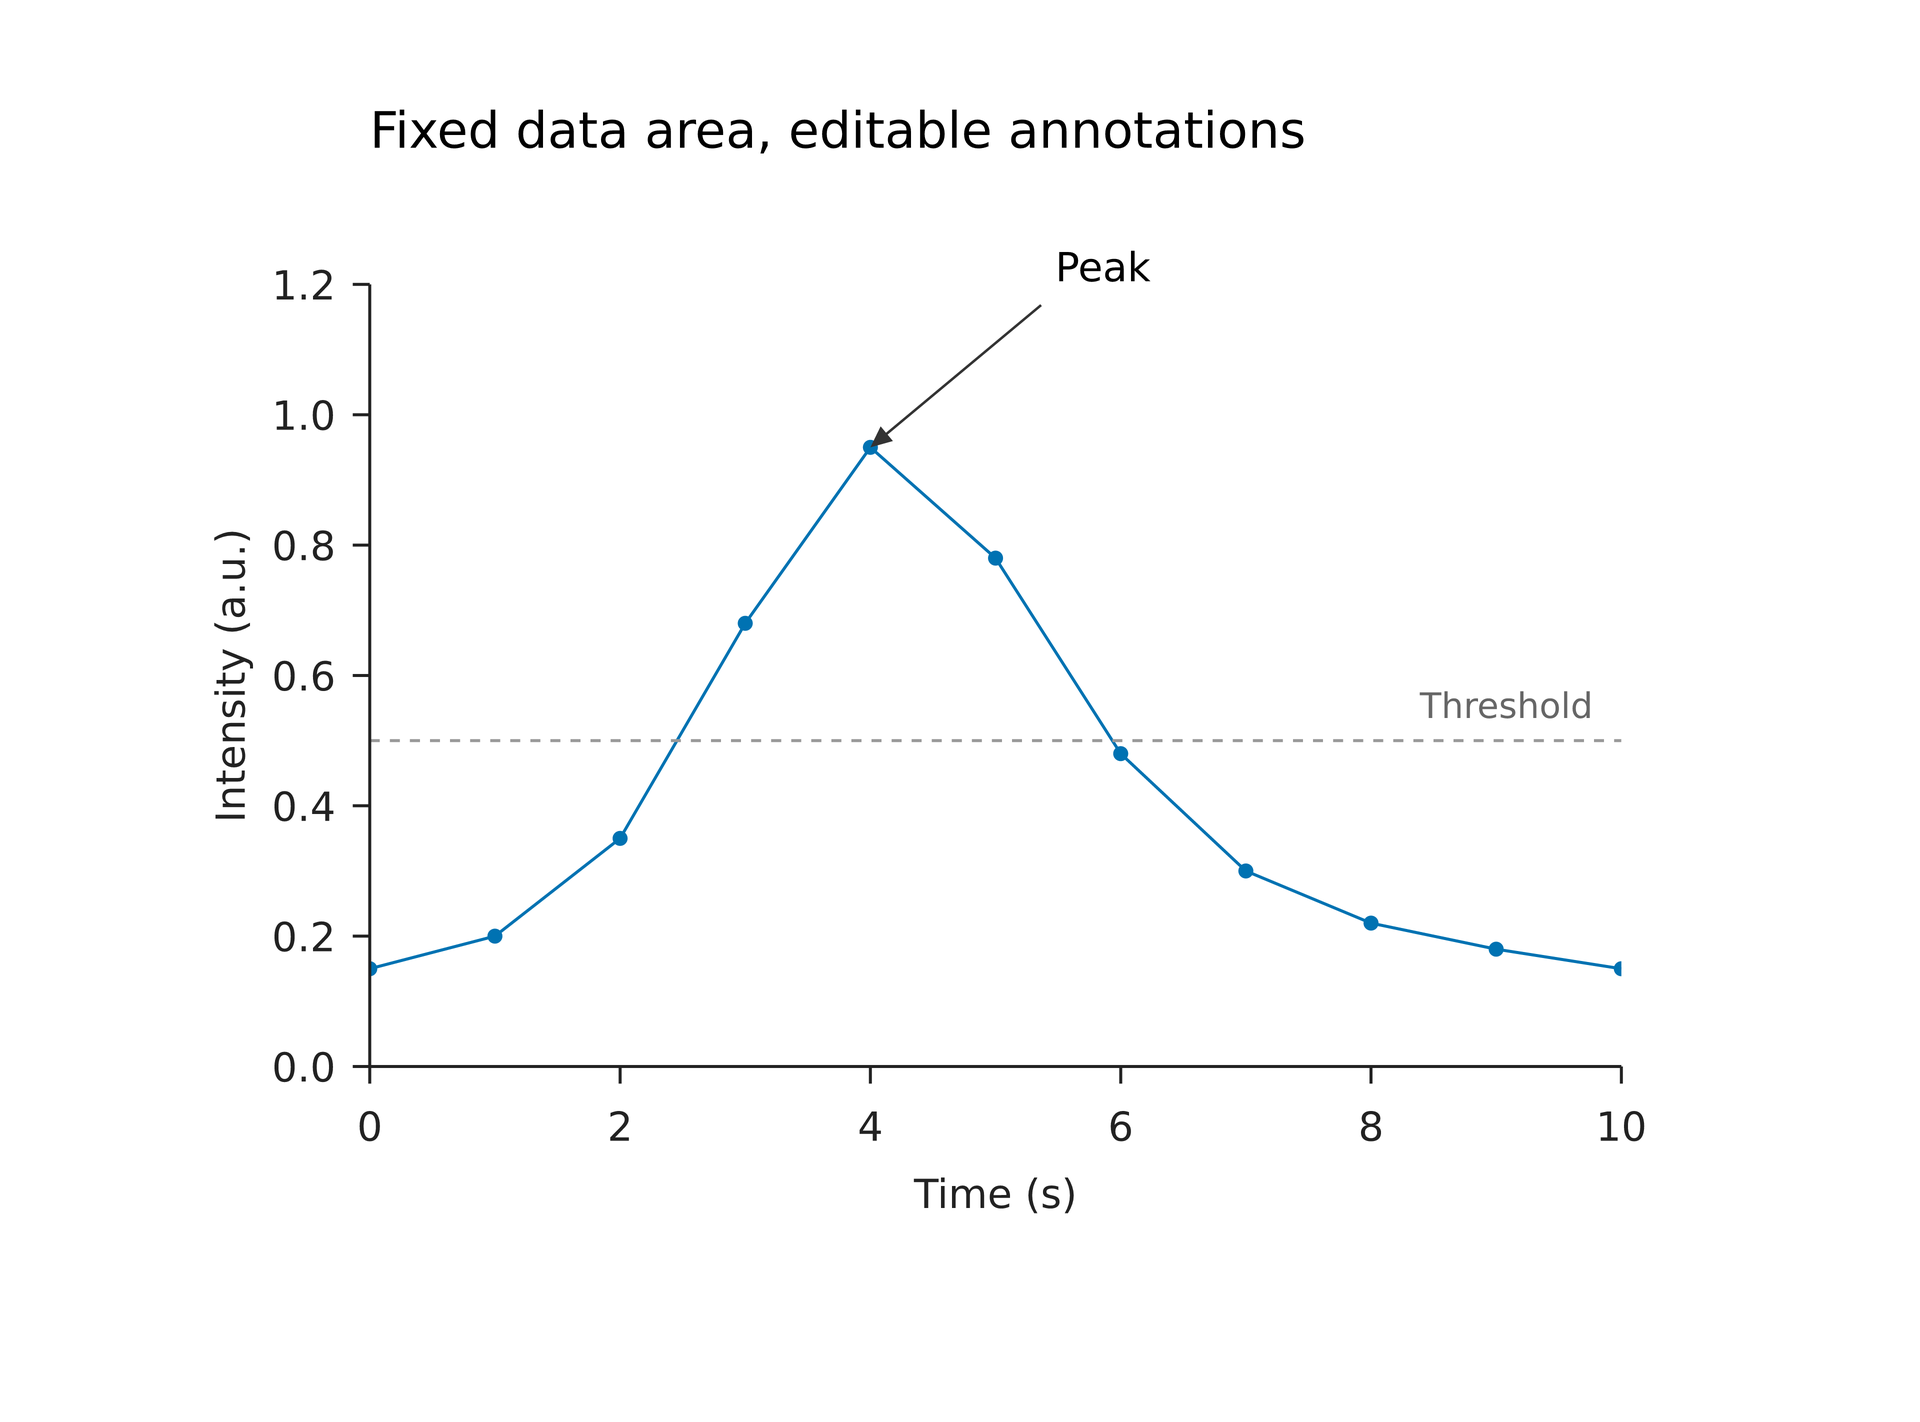
# The data rectangle stays 88 x 55 mm, with its top-left corner at (26, 20) mm.page = canvas(size=(135 mm, 100 mm), background="#ffffff")style = plot_style(font_family="DejaVu Sans", font_size=8 pt, line_width=0.6 pt)p = plot(size=(120 mm, 84 mm), plot_area=box(offset=(18 mm, 8 mm), size=(88 mm, 55 mm)), x=axis(label="Time (s)", range=(0, 10)), y=axis(label="Intensity (a.u.)", range=(0, 1.2), format=".1f"), style=style)p.line(x=[0, 1, 2, 3, 4, 5, 6, 7, 8, 9, 10], y=[0.15, 0.2, 0.35, 0.68, 0.95, 0.78, 0.48, 0.3, 0.22, 0.18, 0.15])p.scatter(x=[0, 1, 2, 3, 4, 5, 6, 7, 8, 9, 10], y=[0.15, 0.2, 0.35, 0.68, 0.95, 0.78, 0.48, 0.3, 0.22, 0.18, 0.15], color="#0072B2", marker_size=3 pt)p.hline(y=0.5, color="#999999", line_dash=[2 pt, 2 pt]) # Outer dimensions may change; this placement pins the data origin on the page.# The data rectangle stays 88 x 55 mm, with its top-left corner at (26, 20) mm.page = canvas(size=(135 mm, 100 mm), background="#ffffff")style = plot_style(font_family="DejaVu Sans", font_size=8 pt, line_width=0.6 pt)p = plot(size=(120 mm, 84 mm), plot_area=box(offset=(18 mm, 8 mm), size=(88 mm, 55 mm)), x=axis(label="Time (s)", range=(0, 10)), y=axis(label="Intensity (a.u.)", range=(0, 1.2), format=".1f"), style=style)p.line(x=[0, 1, 2, 3, 4, 5, 6, 7, 8, 9, 10], y=[0.15, 0.2, 0.35, 0.68, 0.95, 0.78, 0.48, 0.3, 0.22, 0.18, 0.15])p.scatter(x=[0, 1, 2, 3, 4, 5, 6, 7, 8, 9, 10], y=[0.15, 0.2, 0.35, 0.68, 0.95, 0.78, 0.48, 0.3, 0.22, 0.18, 0.15], color="#0072B2", marker_size=3 pt)p.hline(y=0.5, color="#999999", line_dash=[2 pt, 2 pt]) # Outer dimensions may change; this placement pins the data origin on the page.chart = page.add(p, anchor= plot_top_left, target=page.top_left, offset=(26 mm, 20 mm)) # Only this coordinate depends on the data. The arrow and label offsets use mm.peak = chart.data(x=4, y=0.95)pointer = page.add(line(end_head=head(), dx=-12 mm, dy=10 mm, line_color="#333333", line_width=0.5 pt), anchor= end, target=peak)page.add(text(content="Peak", font_family="DejaVu Sans", font_size=8 pt), anchor=bottom_left, target=pointer.start, offset=(1 mm, -1 mm))page.add(text(content="Threshold", font_family="DejaVu Sans", font_size=7 pt, color="#666666"), anchor=bottom_right, target=chart.data(x=10, y=0.5), offset=(-2 mm, -1 mm))page.add(text(content="Fixed data area, editable annotations", font_family="DejaVu Sans", font_size=10 pt), target=chart.plot_top_left, offset=(0 mm, -13 mm))Preview
Dependencies
examples/plot/annotations.lay
Common errors and limits#
The definition p is not a placed chart: use the return from chart=page.add(p). Data anchors in hidden axis intervals error; outside values are not silently clamped to the edge.
Individual functions#
plot-hline#
Horizontal reference line layer: add data to this plot, control its appearance with physical style parameters, and select data mappings with named-axis parameters.
Returns: A layer handle that can be included in a shared legend.
Minimal complete source · Composition source · All parameters
plot-vline#
Vertical reference line layer: add data to this plot, control its appearance with physical style parameters, and select data mappings with named-axis parameters.
Returns: A layer handle that can be included in a shared legend.
Minimal complete source · Composition source · All parameters
Detailed behavior and further examples#
Parameters#
| Parameter | Purpose | Default or requirement |
|---|---|---|
data(x=..., y=...) |
Position in data coordinates | Use original data units |
plot_* |
Nine plot-area anchors | Follows instance transforms |
Common usage#
Use plot_area=box(offset=(left,top), size=(width,height)) to lock the data rectangle relative to the outer plot frame. All four values are physical lengths: left/top must be nonnegative, width/height positive, and boundaries finite. Extending beyond size produces a warning and retains the rectangle. This option is mutually exclusive with margins. Placement width/height overrides change the surrounding space while preserving the data rectangle. Changes to fonts, ticks, labels, legends or colorbars also preserve it; insufficient space produces a located W_PLOT_LAYOUT warning and output continues. In this mode axis and colorbar labels stay next to their respective axes when the outer frame grows.
chart.data(x=...,y=...)returns an anchor on a placed plot instance. Values must be finite, unitless numbers within the resolved domains, including endpoints; log coordinates must be positive. It uses that instance's final layout and does not change the domains. Recompiling after an axis-range change keeps the annotation at the same data value. Out-of-range anchors raise an error.- Annotation
offsetvalues are physical displacements in the shared container. Text and arrows remain independent elements: they may extend outside the data clip, have no automatic collision avoidance, and do not expand the plot's outer frame. - Nine data-rectangle anchors are available:
plot_top_left/plot_top_center/plot_top_right,plot_middle_left/plot_center/plot_middle_right, andplot_bottom_left/plot_bottom_center/plot_bottom_right. Usetarget=chart.plot_top_leftor the quoted placement optionanchor="plot_top_left"to position the data rectangle directly on the page. - Lines and arrows support
anchor="start"/"end"as well aspointer.start/endtargets. Plot and endpoint anchors rotate with their instances; the original nine outer anchors still use the rotated axis-aligned bounding box. New placement anchor names require quotes and add no reserved words. - An annotation and its target must belong to the same canvas or group. Place both inside a group to scale or rotate the whole annotated figure together; the usual group rules scale physical dimensions too. Each plot remains independently positionable and editable.
Data coordinates, data-rectangle anchors and physical offsets can be combined directly. anchor selects the placed element's own alignment point; target supplies its destination. The example offsets follow page coordinates, rather than the rotated chart's local coordinates.
Editable source · SVG · PDF. The example fixes an 88 × 55 mm data area with its top-left at (26, 20) mm on the page. The peak arrow, threshold label and title are separate placements.
Limits and related topics#
Data input and missing values · Plot area and physical size · Axes and ticks · Labels and scientific notation · Legends and shared colorbars