 LayMesh
Multiple axes and breaks#
Purpose and concepts#
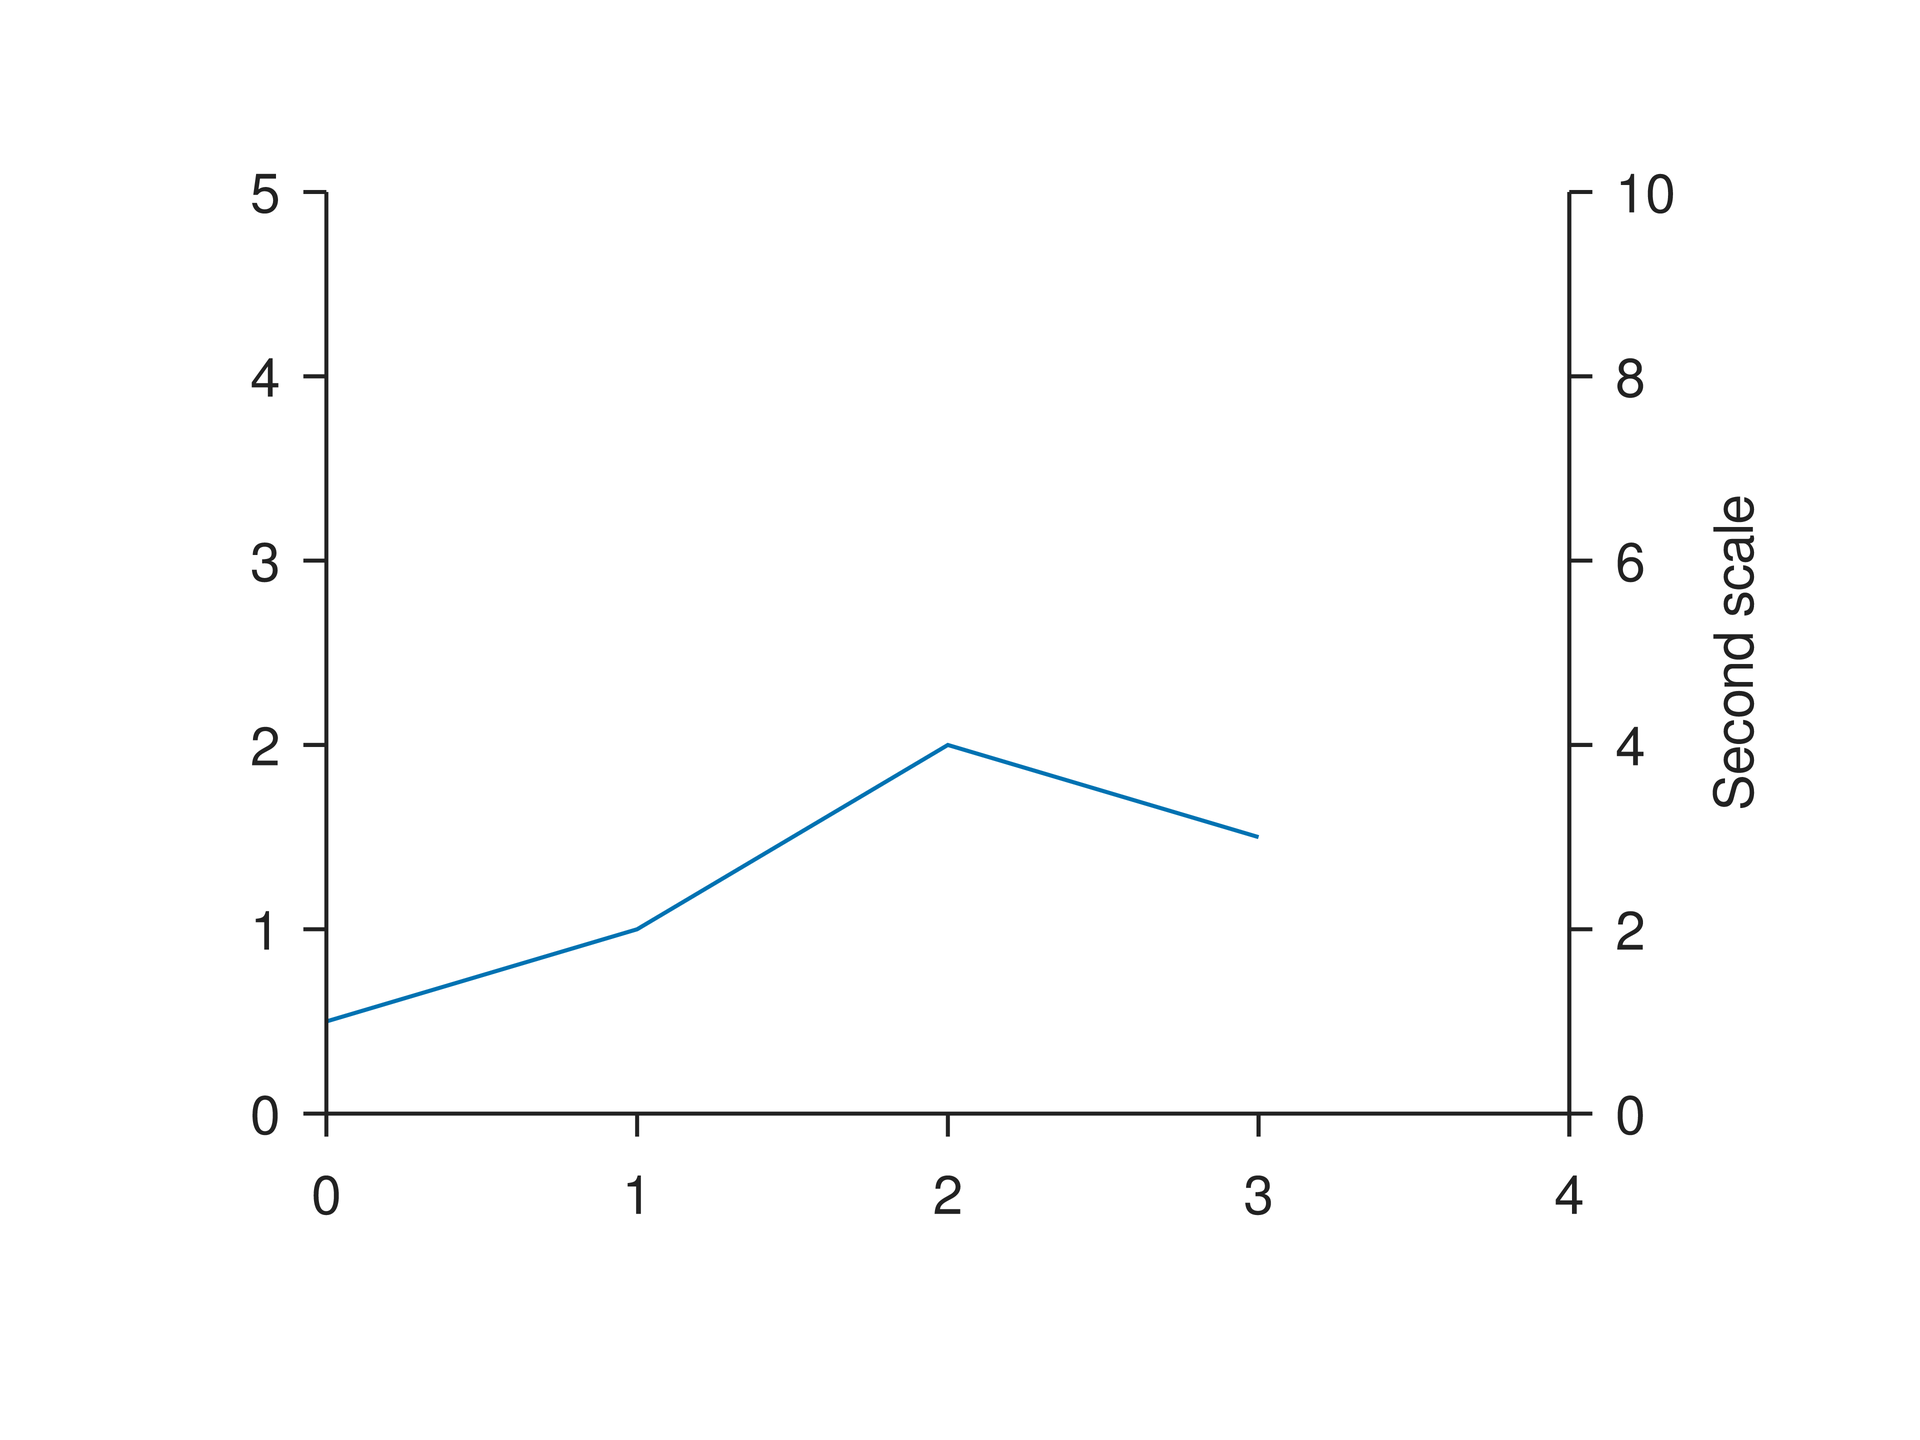
Named axes let each layer select its mapping. Primary names are x/y; add_axis gives an extra axis a unique name and left/right/top/bottom position. Layers bind through x_axis/y_axis.
Minimal complete example#
Run this file directly with laymesh validate or laymesh render; it contains its own canvas and required definitions.
# Minimal complete example: plot.add_axispage=canvas(size=(100mm,75mm),background="#ffffff")p=plot(size=(86mm,62mm),x=axis(range=(0,4)),y=axis(range=(0,5)))p.add_axis(name="right_y",side=right,axis=axis(range=(0,10),label="Second scale"))p.line(x=[0,1,2,3],y=[1,2,4,3],y_axis="right_y")page.add(p,offset=(7mm,6mm))# Minimal complete example: plot.add_axispage=canvas(size=(100mm,75mm),background="#ffffff")p=plot(size=(86mm,62mm),x=axis(range=(0,4)),y=axis(range=(0,5)))p.add_axis(name="right_y",side=right,axis=axis(range=(0,10),label="Second scale"))p.line(x=[0,1,2,3],y=[1,2,4,3],y_axis="right_y")page.add(p,offset=(7mm,6mm))Preview
Dependencies
examples/manual/plot-add_axis.lay
Parameters and default behavior#
Unitless geometry uses the canvas unit; unitless type and stroke sizes use pt. Explicit call parameters override inherited/theme defaults. The linked interface reference lists accepted types, choices and defaults per parameter.
Composition#
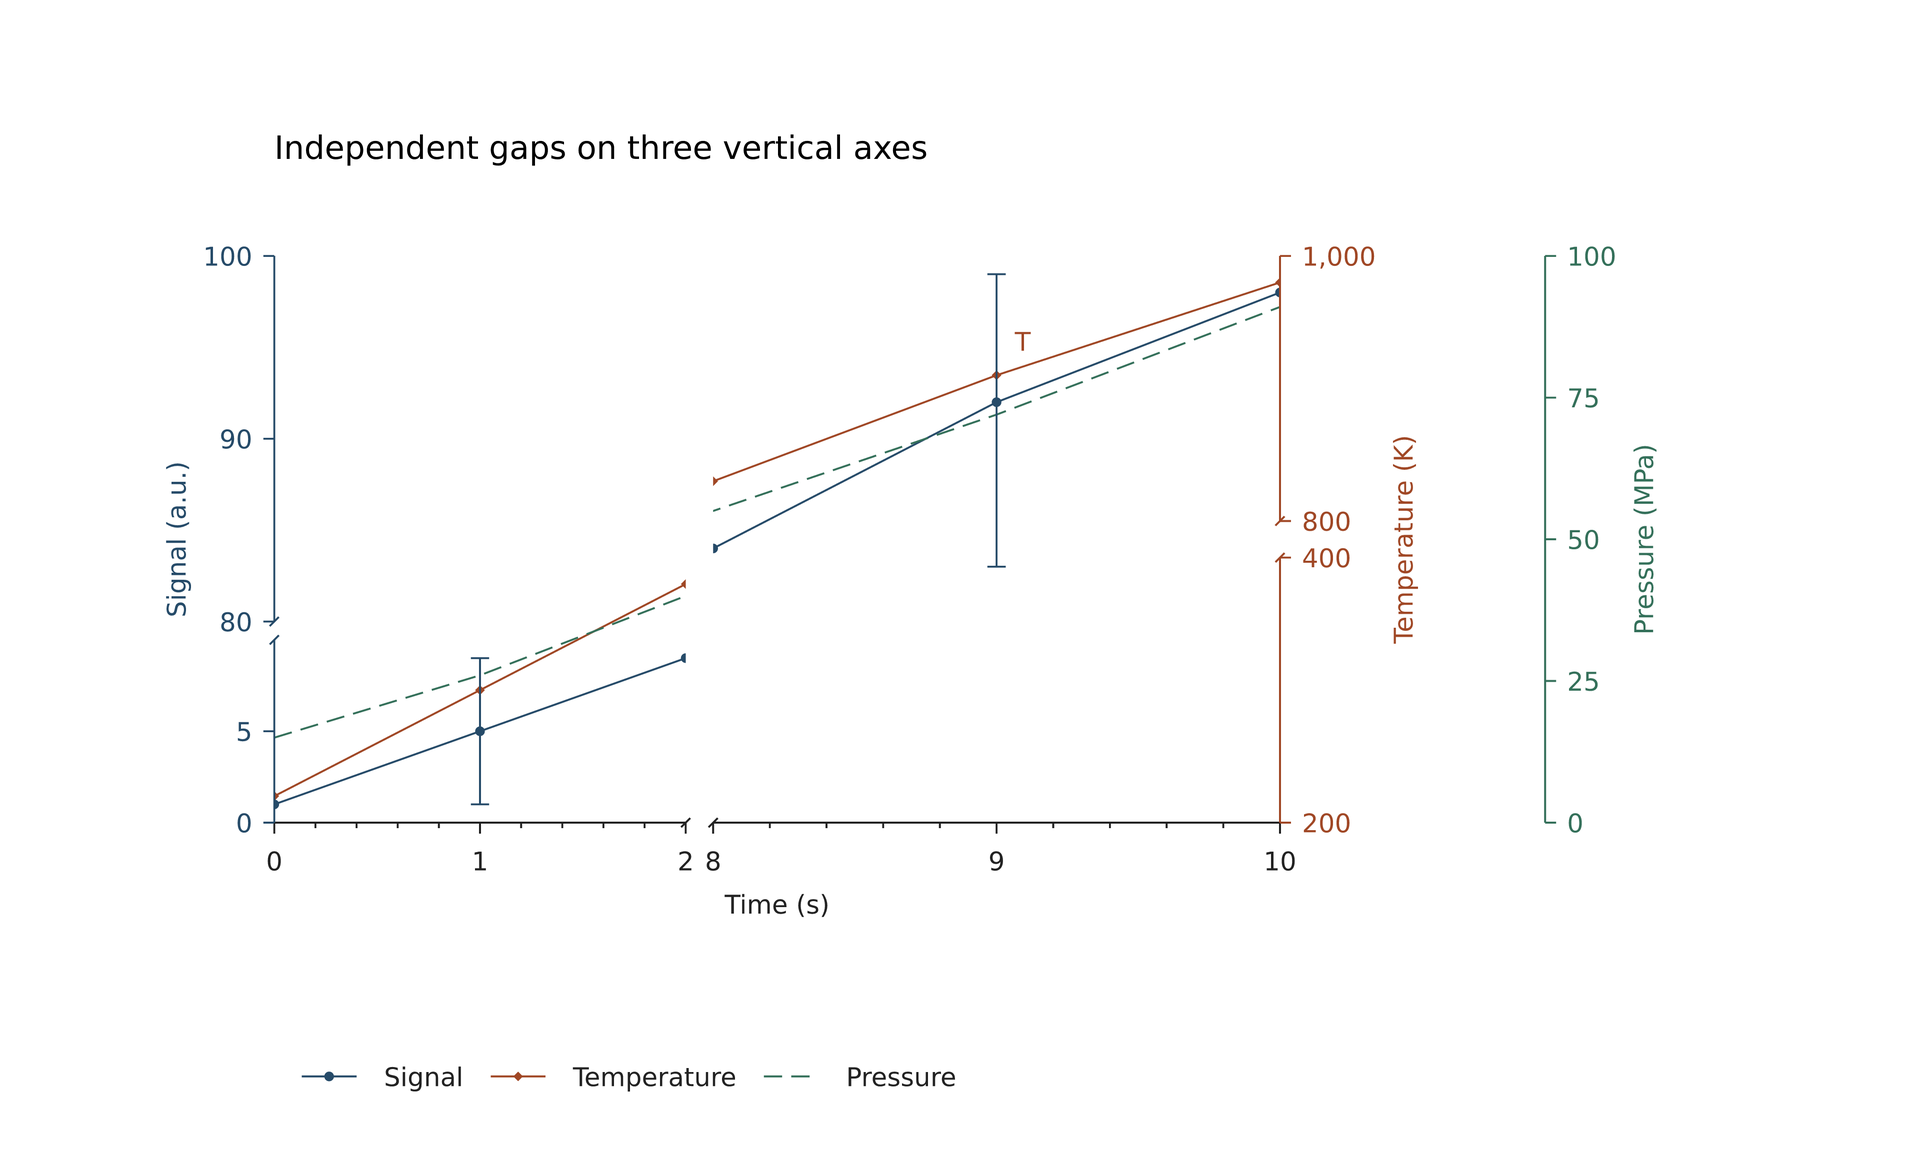
Overlay a secondary-axis line with primary-axis bars. Each axis may have independent breaks/segment_lengths. Data anchors must select the matching axis names.
# Independent axis gaps. Lengths are literal mm, not stretch factors.page=canvas(size=(210 mm,128 mm),background="#ffffff")s=plot_style(font_family="DejaVu Sans",font_size=8 pt)p=plot(size=(195 mm,112 mm),plot_area=box(offset=(24 mm, 20 mm), size=(110 mm, 62 mm)),style=s, x=axis(label="Time (s)",range=(0,10),ticks=[0,1,2,8,9,10],breaks=[(2,8)],break_gap=3 mm,segment_lengths=[45 mm,62 mm],minor_ticks="auto"), y=axis(label="Signal (a.u.)",range=(0,100),ticks=[0,5,80,90,100],breaks=[(10,80)],break_gap=2 mm,segment_lengths=[20 mm,40 mm],line_color="#264b69"))p.add_axis(name="temperature",side= right,offset=0 mm, axis=axis(label="Temperature (K)",range=(200,1000),ticks=[200,400,800,1000],breaks=[(400,800)],break_gap=4 mm,segment_lengths=[29 mm,29 mm],line_color="#a04725"))p.add_axis(name="pressure",side= right,offset=29 mm, axis=axis(label="Pressure (MPa)",range=(0,100),ticks=[0,25,50,75,100],line_color="#34705a"))a=p.line(x=[0,1,2,8,9,10],y=[1,5,9,84,92,98],marker= circle,color="#264b69",label="Signal")b=p.line(x=[0,1,2,8,9,10],y=[220,300,380,830,910,980],y_axis="temperature",marker= diamond,color="#a04725",label="Temperature")c=p.line(x=[0,1,2,8,9,10],y=[15,26,40,55,72,91],y_axis="pressure",line_dash=[2 mm,1 mm],color="#34705a",label="Pressure")p.errorbar(x=[1,9],y=[5,91],yerr=[4,8],color="#264b69",cap_size=2 mm)chart=page.add(p,offset=(6 mm,8 mm))page.add(text(content="Independent gaps on three vertical axes",font_family="DejaVu Sans",font_size=10 pt),target=chart.plot_top_left,offset=(0 mm,-14 mm))page.add(legend(layers=[a,b,c],columns=3,gap=3 mm,background="none"),target=chart.plot_bottom_left,offset=(0 mm,23 mm))# This data anchor uses temperature values, including its independent break.page.add(text(content="T",font_family="DejaVu Sans",font_size=8 pt,color="#a04725"),anchor=bottom_left,target=chart.data(x=9,y=910,y_axis="temperature"),offset=(2 mm,-2 mm))# BEGIN DEMO# Independent axis gaps. Lengths are literal mm, not stretch factors.page=canvas(size=(210 mm,128 mm),background="#ffffff")s=plot_style(font_family="DejaVu Sans",font_size=8 pt)p=plot(size=(195 mm,112 mm),plot_area=box(offset=(24 mm, 20 mm), size=(110 mm, 62 mm)),style=s, x=axis(label="Time (s)",range=(0,10),ticks=[0,1,2,8,9,10],breaks=[(2,8)],break_gap=3 mm,segment_lengths=[45 mm,62 mm],minor_ticks="auto"), y=axis(label="Signal (a.u.)",range=(0,100),ticks=[0,5,80,90,100],breaks=[(10,80)],break_gap=2 mm,segment_lengths=[20 mm,40 mm],line_color="#264b69"))p.add_axis(name="temperature",side= right,offset=0 mm, axis=axis(label="Temperature (K)",range=(200,1000),ticks=[200,400,800,1000],breaks=[(400,800)],break_gap=4 mm,segment_lengths=[29 mm,29 mm],line_color="#a04725"))p.add_axis(name="pressure",side= right,offset=29 mm, axis=axis(label="Pressure (MPa)",range=(0,100),ticks=[0,25,50,75,100],line_color="#34705a"))a=p.line(x=[0,1,2,8,9,10],y=[1,5,9,84,92,98],marker= circle,color="#264b69",label="Signal")b=p.line(x=[0,1,2,8,9,10],y=[220,300,380,830,910,980],y_axis="temperature",marker= diamond,color="#a04725",label="Temperature")c=p.line(x=[0,1,2,8,9,10],y=[15,26,40,55,72,91],y_axis="pressure",line_dash=[2 mm,1 mm],color="#34705a",label="Pressure")p.errorbar(x=[1,9],y=[5,91],yerr=[4,8],color="#264b69",cap_size=2 mm)chart=page.add(p,offset=(6 mm,8 mm))page.add(text(content="Independent gaps on three vertical axes",font_family="DejaVu Sans",font_size=10 pt),target=chart.plot_top_left,offset=(0 mm,-14 mm))page.add(legend(layers=[a,b,c],columns=3,gap=3 mm,background="none"),target=chart.plot_bottom_left,offset=(0 mm,23 mm))# This data anchor uses temperature values, including its independent break.page.add(text(content="T",font_family="DejaVu Sans",font_size=8 pt,color="#a04725"),anchor=bottom_left,target=chart.data(x=9,y=910,y_axis="temperature"),offset=(2 mm,-2 mm))# END DEMOPreview
Dependencies
examples/plot/multi-axes-breaks.lay
Common errors and limits#
Same-side axes do not automatically make room for one another. Breaks must increase without overlap inside an explicit domain. segment_lengths plus gaps must match the data edge; no automatic rescaling occurs.
Individual functions#
plot-add_axis#
Add a uniquely named axis to an unplaced chart. side chooses direction/location, layers select it with x_axis/y_axis, and same-side spacing needs explicit offset.
Returns: axis
Required inputs: name, side, axis.
Minimal complete source · Composition source · All parameters
Detailed behavior and further examples#
Parameters#
| Parameter | Purpose | Default or requirement |
|---|---|---|
x_axis / y_axis |
Layer axis binding | x / y |
break_gap |
Physical break gap | 2 mm |
segment_lengths |
Visible segment lengths | Transformed-span allocation when omitted |
Common usage#
The primary names are x/y. Added names must be nonempty and unique. side="left|right|top|bottom" defaults to right. offset=0 mm is measured outward from the corresponding data edge; negative values are allowed. Axes on the same side do not push one another apart. Every layer accepts x_axis/y_axis (defaults x/y), rejecting missing names and wrong directions. Each automatic domain uses only its own bound data; an unused axis needs an explicit range.
chart.data(...) uses original values with the selected axes' transforms, reversal and segments. chart.axis(name=...,anchor="start|center|end") uses the domain minimum/maximum for start/end even on a reversed axis. Center is the physical midpoint, possibly within a gap. Both kinds of anchors follow instance rotation and group scaling. Placement offsets use the surrounding page or group's coordinate system.
| Axis option | Behavior |
|---|---|
reverse=false |
Reverse display, preserving input data and statistics |
scale="symlog", constant=1 |
Transform sign(x)*log(1+abs(x)/constant); positive constant in original data units, allowing zero and negatives |
tick_text=[...] |
Strings, text or formula definitions; requires equally long explicit ticks, in input order |
tick_rotation=0 deg |
Rotate around each label center; placement measures rotated bounds |
tick_offset=(0 mm,0 mm) |
Local physical offset, right/down positive |
tick_font_size=..., tick_color="#..." |
Independent tick and multiplier styles; tick marks also use tick_color. Explicit text/formula asset styles remain intact |
line_color="#...", line_width=... |
Axis line/default text color and physical stroke width; tick_color can override tick color |
spine=false |
Hide the spine and its break marks while retaining ticks and labels |
minor_ticks="auto" |
Opt in; subdivide numeric intervals into fifths for linear/symlog axes, or decimal 2–9 ticks for log axes. Original default remains an empty list |
| `grid="none | major |
Existing label_offset/exponent_offset remain independent. Categories require explicit numeric positions and tick_text; neither category order nor axis selection is inferred.
Breaks hide open intervals and retain their endpoints. They must be increasing, disjoint, and strictly inside an explicit range. break_gap defaults to 2 mm and accepts one positive physical length or a list with one per gap. break_mark_size sets the physical width/height of each slash.
Without segment_lengths, subtract the gaps and allocate the remaining length in proportion to each visible interval's transformed span. Explicit lengths must be positive, number one more than the gaps, and sum with the gaps to the corresponding plot edge within 1e-6 mm. A mismatch errors instead of rescaling. Use plot_area for exact segment dimensions.
Each layer draws and clips inside the Cartesian products of its own two axes' visible intervals. Other axes can have different hidden ranges, gap locations and segment lengths, or no breaks. Lines, error bars, bars, fills and heatmaps are split accordingly. Clipping never invents error caps and no white strip masks another layer. Explicit ticks inside hidden intervals are omitted; data anchors there error.
Inspection reports plot bounds, domains/transforms, visible segments with physical lengths, gaps with widths, and decoration bounds in local mm. page_transform=[a,b,c,d,e,f] maps local coordinates to the page: X=a*x+c*y+e, Y=b*x+d*y+f, including instance rotation and ancestor group scaling.
Limits and related topics#
Lines and scatter · Error bars and bands · Bars and steps · Heatmaps and contours