 LayMesh
Annotations
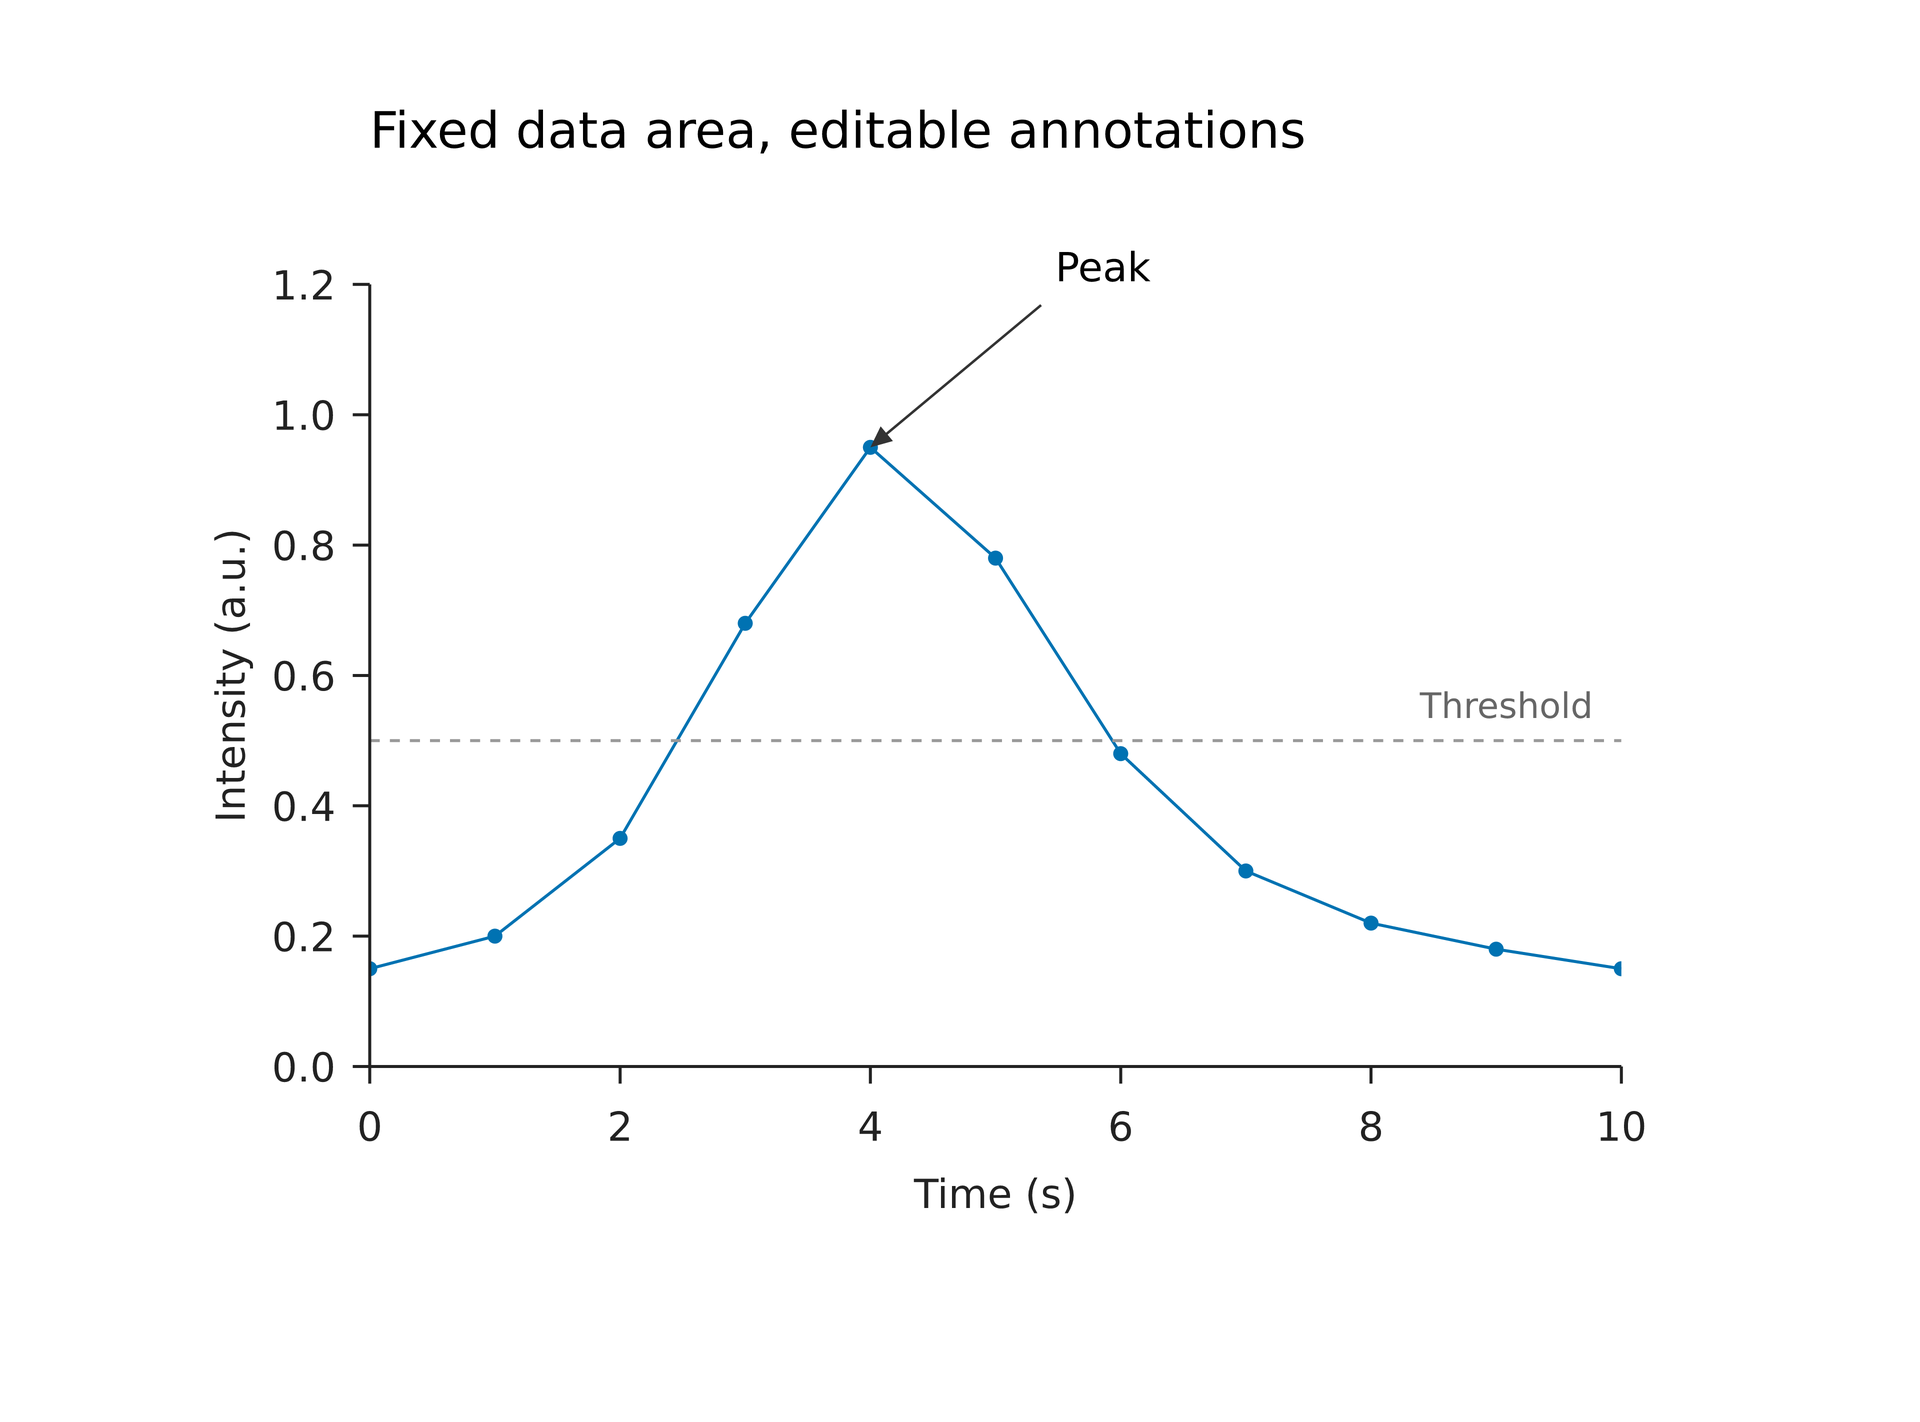
# The data rectangle stays 88 x 55 mm, with its top-left corner at (26, 20) mm.page = canvas(size=(135 mm, 100 mm), background="#ffffff")style = plot_style(font_family="DejaVu Sans", font_size=8 pt, line_width=0.6 pt)p = plot(size=(120 mm, 84 mm), plot_area=box(offset=(18 mm, 8 mm), size=(88 mm, 55 mm)), x=axis(label="Time (s)", range=(0, 10)), y=axis(label="Intensity (a.u.)", range=(0, 1.2), format=".1f"), style=style)p.line(x=[0, 1, 2, 3, 4, 5, 6, 7, 8, 9, 10], y=[0.15, 0.2, 0.35, 0.68, 0.95, 0.78, 0.48, 0.3, 0.22, 0.18, 0.15])p.scatter(x=[0, 1, 2, 3, 4, 5, 6, 7, 8, 9, 10], y=[0.15, 0.2, 0.35, 0.68, 0.95, 0.78, 0.48, 0.3, 0.22, 0.18, 0.15], color="#0072B2", marker_size=3 pt)p.hline(y=0.5, color="#999999", line_dash=[2 pt, 2 pt]) # Outer dimensions may change; this placement pins the data origin on the page.# The data rectangle stays 88 x 55 mm, with its top-left corner at (26, 20) mm.page = canvas(size=(135 mm, 100 mm), background="#ffffff")style = plot_style(font_family="DejaVu Sans", font_size=8 pt, line_width=0.6 pt)p = plot(size=(120 mm, 84 mm), plot_area=box(offset=(18 mm, 8 mm), size=(88 mm, 55 mm)), x=axis(label="Time (s)", range=(0, 10)), y=axis(label="Intensity (a.u.)", range=(0, 1.2), format=".1f"), style=style)p.line(x=[0, 1, 2, 3, 4, 5, 6, 7, 8, 9, 10], y=[0.15, 0.2, 0.35, 0.68, 0.95, 0.78, 0.48, 0.3, 0.22, 0.18, 0.15])p.scatter(x=[0, 1, 2, 3, 4, 5, 6, 7, 8, 9, 10], y=[0.15, 0.2, 0.35, 0.68, 0.95, 0.78, 0.48, 0.3, 0.22, 0.18, 0.15], color="#0072B2", marker_size=3 pt)p.hline(y=0.5, color="#999999", line_dash=[2 pt, 2 pt]) # Outer dimensions may change; this placement pins the data origin on the page.chart = page.add(p, anchor= plot_top_left, target=page.top_left, offset=(26 mm, 20 mm)) # Only this coordinate depends on the data. The arrow and label offsets use mm.peak = chart.data(x=4, y=0.95)pointer = page.add(line(end_head=head(), dx=-12 mm, dy=10 mm, line_color="#333333", line_width=0.5 pt), anchor= end, target=peak)page.add(text(content="Peak", font_family="DejaVu Sans", font_size=8 pt), anchor=bottom_left, target=pointer.start, offset=(1 mm, -1 mm))page.add(text(content="Threshold", font_family="DejaVu Sans", font_size=7 pt, color="#666666"), anchor=bottom_right, target=chart.data(x=10, y=0.5), offset=(-2 mm, -1 mm))page.add(text(content="Fixed data area, editable annotations", font_family="DejaVu Sans", font_size=10 pt), target=chart.plot_top_left, offset=(0 mm, -13 mm))Preview
Background
Dependencies
examples/plot/annotations.lay
Reproduce
laymesh validate examples/plot/annotations.laylaymesh render examples/plot/annotations.lay -o figure.svglaymesh render examples/plot/annotations.lay -o figure.pdflaymesh render examples/plot/annotations.lay -o figure.png --dpi 300