 LayMesh
Scientific Labels
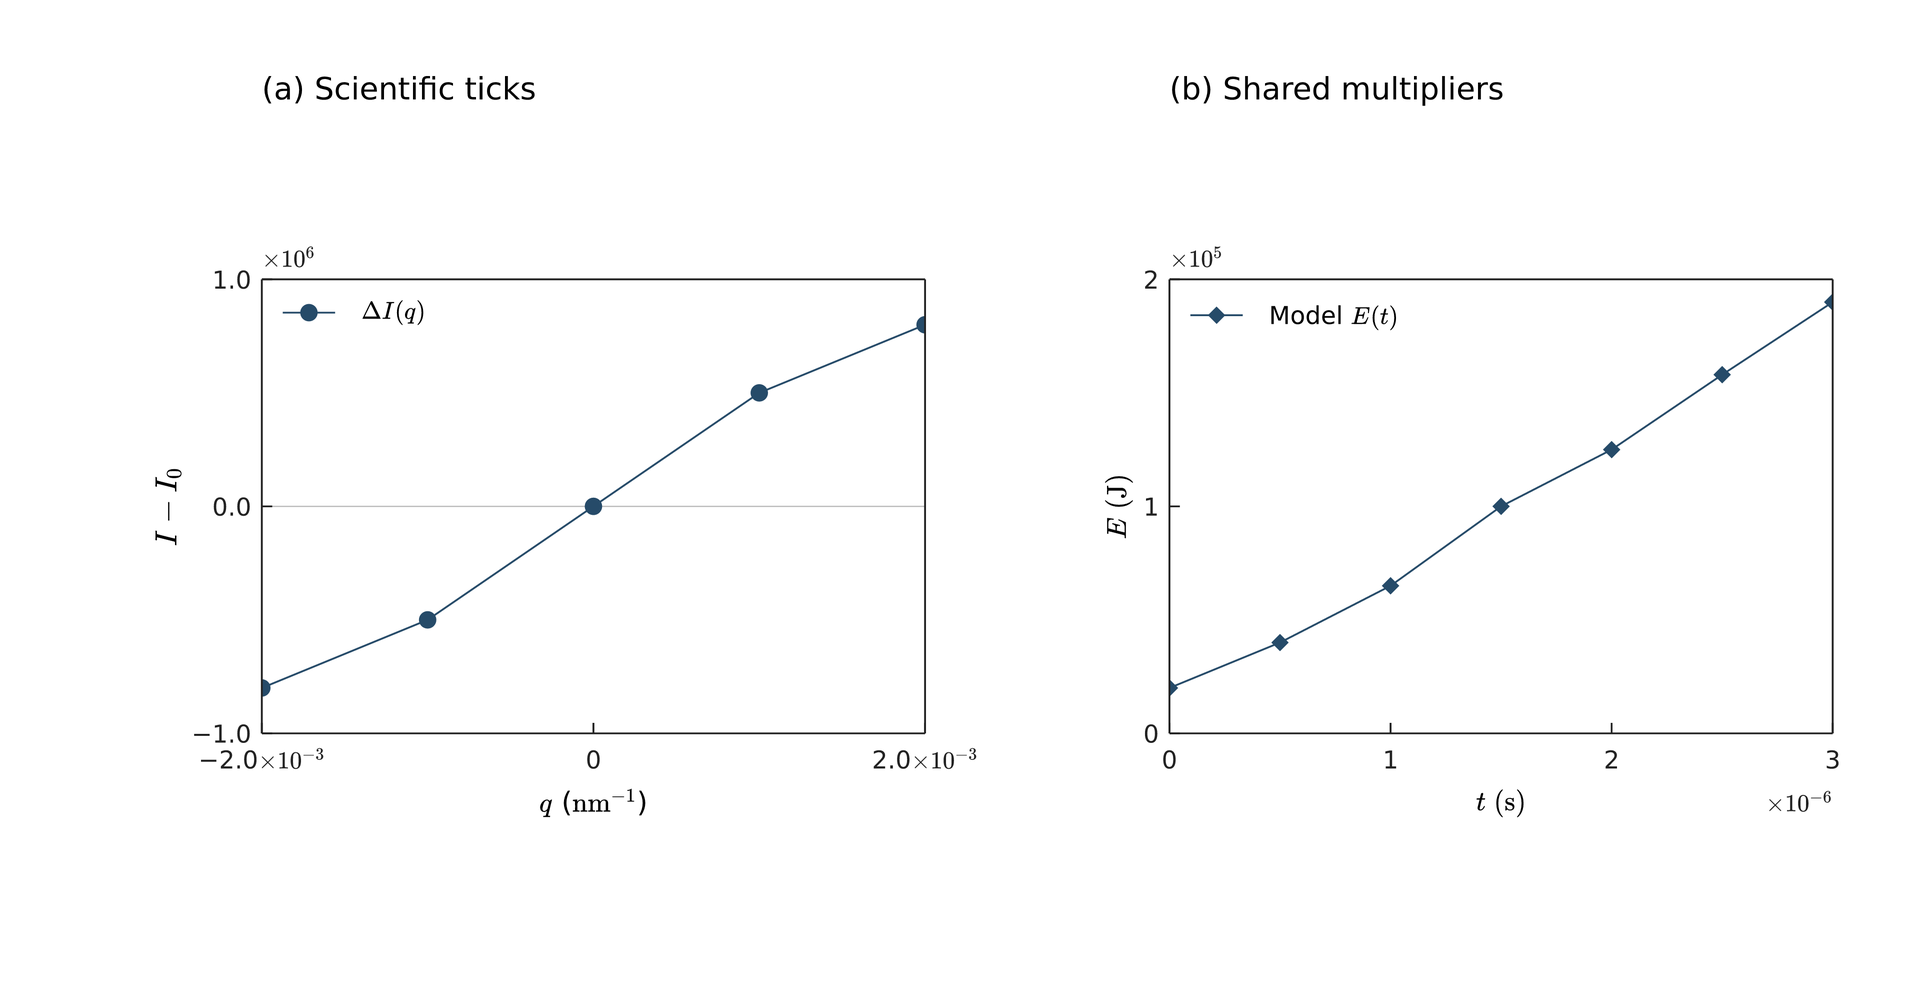
# Two independently placed 76 x 52 mm data rectangles.# Label and exponent offsets are independent chart-local physical lengths (right/down).# The short x title shares the multiplier row; only default collisions add a title row.page = canvas(size=(220 mm, 115 mm), background="#ffffff")style = plot_style(font_family="DejaVu Sans", font_size=8 pt, colors=["#264b69"])q_label = text(spans=[formula(source=r"q", font_size=9 pt), span(" ("), formula(source=r"\mathrm{nm}^{-1}", font_size=9 pt), span(")")], font_family="DejaVu Sans", font_size=9 pt)left = plot(size=(110 mm, 98 mm), plot_area=box(offset=(24 mm, 22 mm), size=(76 mm, 52 mm)), frame= box, style=style, x=axis(label=q_label, range=(-0.002, 0.002), ticks=[-0.002, 0, 0.002], notation= scientific, format=".1e", tick_direction= in), y=axis(label=formula(source=r"I-I_0", font_size=10 pt), range=(-1000000, 1000000), ticks=[-1000000, 0, 1000000], notation= offset, format=".1f", tick_direction= in))left.hline(y=0, color="#bbbbbb", line_width=0.4 pt)# Two independently placed 76 x 52 mm data rectangles.# Label and exponent offsets are independent chart-local physical lengths (right/down).# The short x title shares the multiplier row; only default collisions add a title row.page = canvas(size=(220 mm, 115 mm), background="#ffffff")style = plot_style(font_family="DejaVu Sans", font_size=8 pt, colors=["#264b69"])q_label = text(spans=[formula(source=r"q", font_size=9 pt), span(" ("), formula(source=r"\mathrm{nm}^{-1}", font_size=9 pt), span(")")], font_family="DejaVu Sans", font_size=9 pt)left = plot(size=(110 mm, 98 mm), plot_area=box(offset=(24 mm, 22 mm), size=(76 mm, 52 mm)), frame= box, style=style, x=axis(label=q_label, range=(-0.002, 0.002), ticks=[-0.002, 0, 0.002], notation= scientific, format=".1e", tick_direction= in), y=axis(label=formula(source=r"I-I_0", font_size=10 pt), range=(-1000000, 1000000), ticks=[-1000000, 0, 1000000], notation= offset, format=".1f", tick_direction= in))left.hline(y=0, color="#bbbbbb", line_width=0.4 pt)left.line(x=[-0.002, -0.001, 0, 0.001, 0.002], y=[-800000, -500000, 0, 500000, 800000], marker= circle, marker_size=2 mm, label=formula(source=r"\Delta I(q)", font_size=8 pt))left.legend(position= top_left, background="none")a = page.add(left, anchor= plot_top_left, offset=(30 mm, 32 mm))page.add(text(content="(a) Scientific ticks", font_family="DejaVu Sans", font_size=10 pt), target=a.plot_top_left, offset=(0 mm, -24 mm)) right = plot(size=(110 mm, 98 mm), plot_area=box(offset=(24 mm, 22 mm), size=(76 mm, 52 mm)), frame= box, style=style, x=axis(label=formula(source=r"t\;(\mathrm{s})", font_size=9 pt), range=(0, 0.000003), ticks=[0, 0.000001, 0.000002, 0.000003], notation= offset, exponent=-6, format=".0f", exponent_offset=(0 mm, -0.5 mm), label_offset=(0 mm, 0.5 mm), tick_direction= in), y=axis(label=formula(source=r"E\;(\mathrm{J})", font_size=9 pt), range=(0, 200000), ticks=[0, 100000, 200000], notation= offset, format=".0f", tick_direction= in))right.line(x=[0, 0.0000005, 0.000001, 0.0000015, 0.000002, 0.0000025, 0.000003], y=[20000, 40000, 65000, 100000, 125000, 158000, 190000], marker= diamond, marker_size=2 mm, label=text(spans=[span("Model "), formula(source=r"E(t)", font_size=8 pt)], font_family="DejaVu Sans", font_size=8 pt))right.legend(position= top_left, background="none")b = page.add(right, anchor= plot_top_left, offset=(134 mm, 32 mm))page.add(text(content="(b) Shared multipliers", font_family="DejaVu Sans", font_size=10 pt), target=b.plot_top_left, offset=(0 mm, -24 mm))Preview
Background
Dependencies
examples/plot/scientific-labels.lay
Reproduce
laymesh validate examples/plot/scientific-labels.laylaymesh render examples/plot/scientific-labels.lay -o figure.svglaymesh render examples/plot/scientific-labels.lay -o figure.pdflaymesh render examples/plot/scientific-labels.lay -o figure.png --dpi 300