 LayMesh
Axes and ticks#
Purpose and concepts#
axis configures domain, mapping, ticks and labels. The default primary axes are x/y. Explicit range makes charts comparable. linear, log and symlog are data transforms, not page rotations.
Minimal complete example#
Run this file directly with laymesh validate or laymesh render; it contains its own canvas and required definitions.
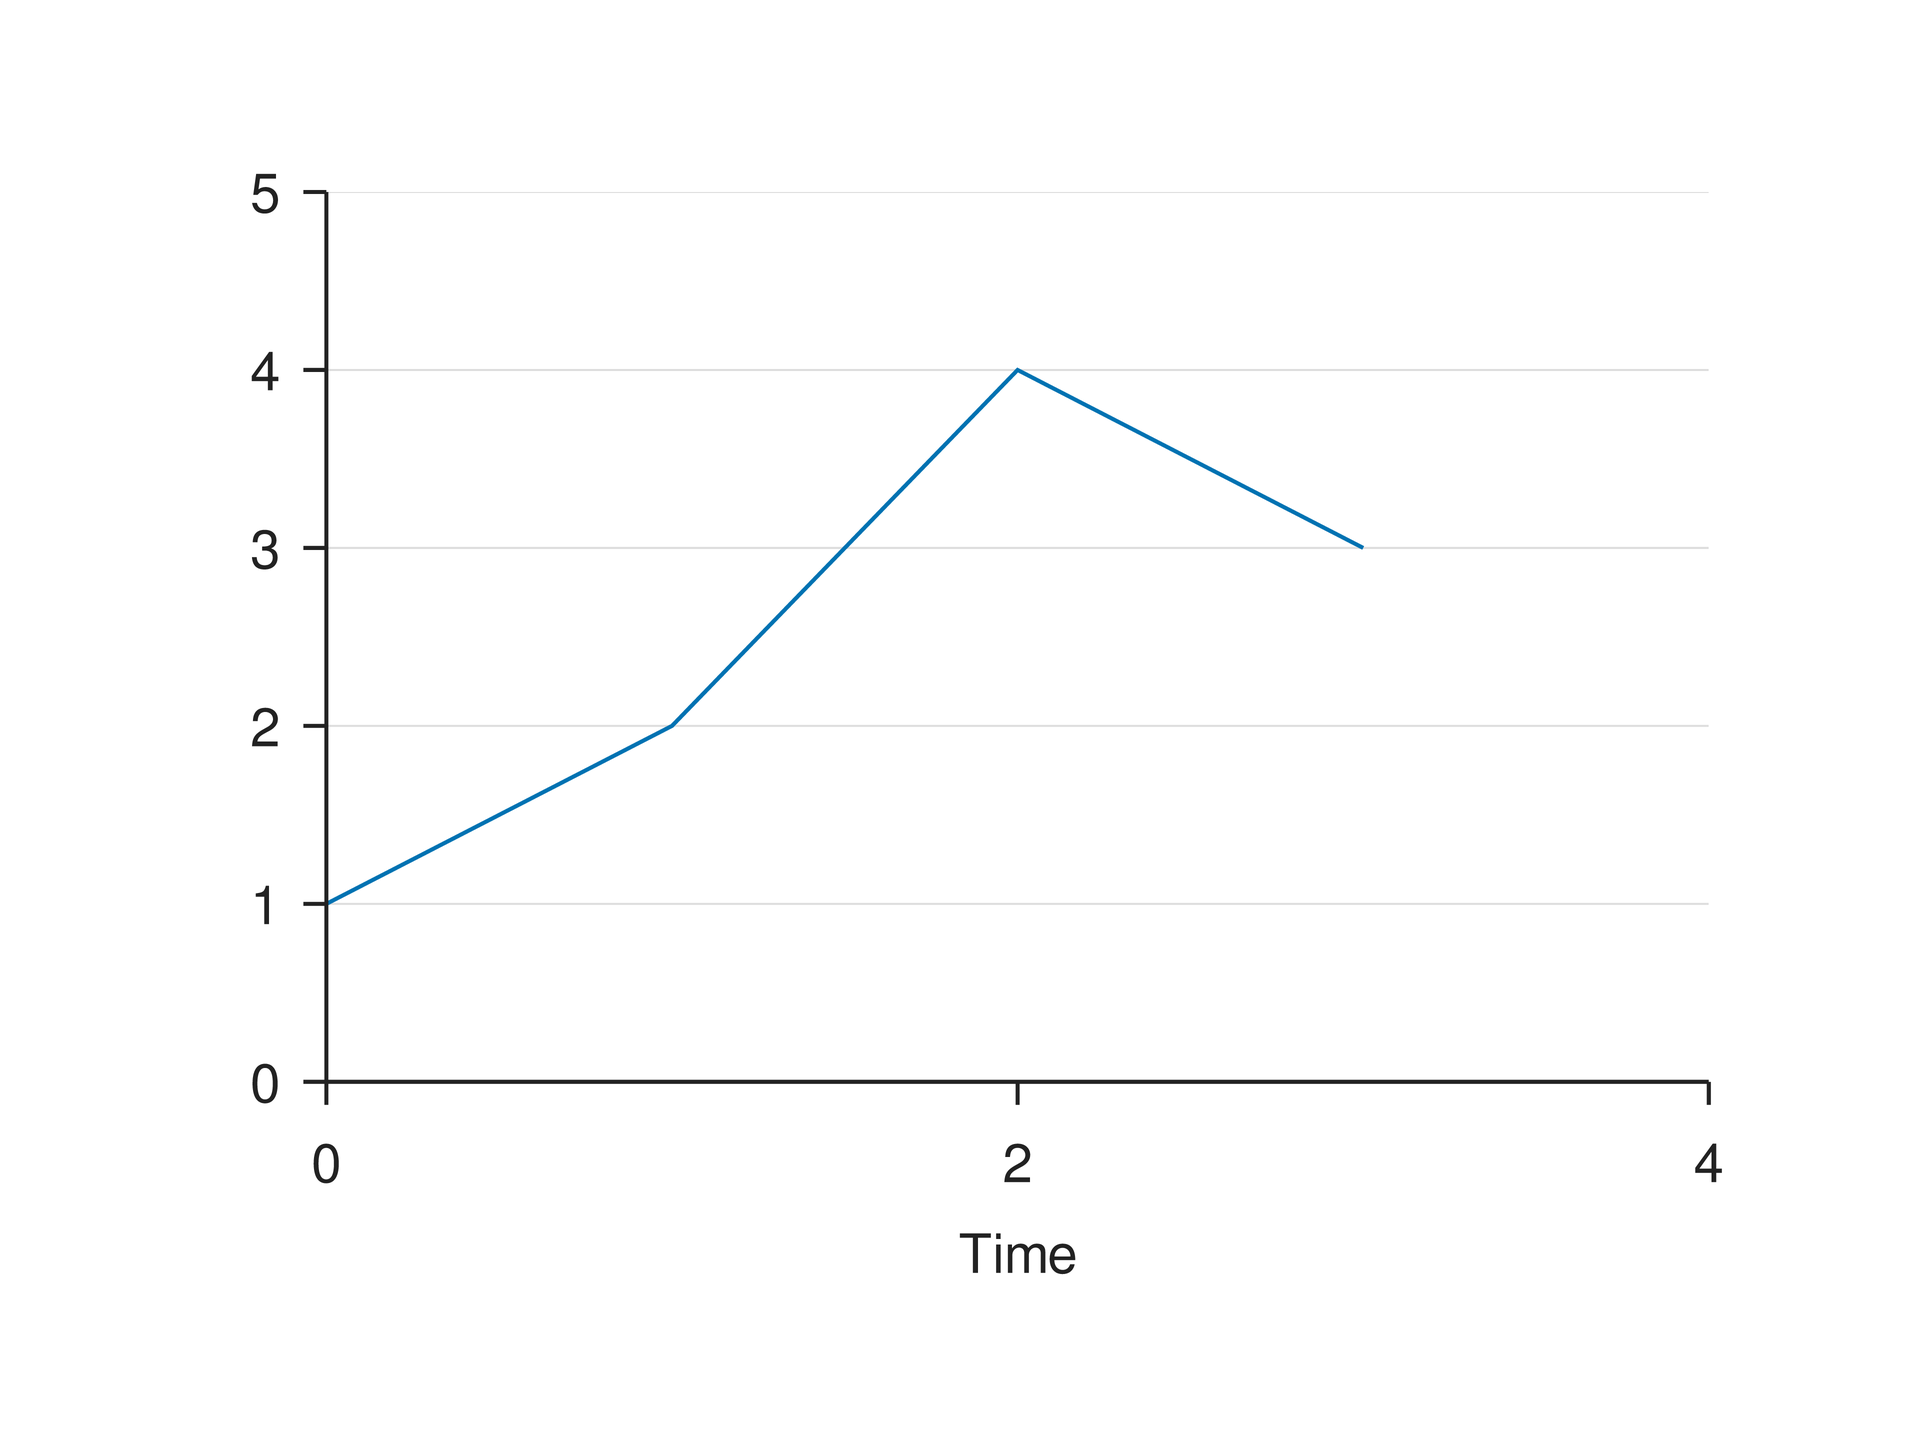
# Minimal complete example: axispage=canvas(size=(100mm,75mm),background="#ffffff")p=plot(size=(86mm,62mm),x=axis(range=(0,4),ticks=[0,2,4],label="Time"),y=axis(range=(0,5),grid=major))p.line(x=[0,1,2,3],y=[1,2,4,3])page.add(p,offset=(7mm,6mm))# Minimal complete example: axispage=canvas(size=(100mm,75mm),background="#ffffff")p=plot(size=(86mm,62mm),x=axis(range=(0,4),ticks=[0,2,4],label="Time"),y=axis(range=(0,5),grid=major))p.line(x=[0,1,2,3],y=[1,2,4,3])page.add(p,offset=(7mm,6mm))Preview
Dependencies
examples/manual/axis.lay
Parameters and default behavior#
Unitless geometry uses the canvas unit; unitless type and stroke sizes use pt. Explicit call parameters override inherited/theme defaults. The linked interface reference lists accepted types, choices and defaults per parameter.
Composition#
Pair ticks with tick_text for category strings or formulas. minor_ticks and grid control subdivisions and background grids. Select chart.axes["x"].spine.path for the spine, or component bounds for title alignment.
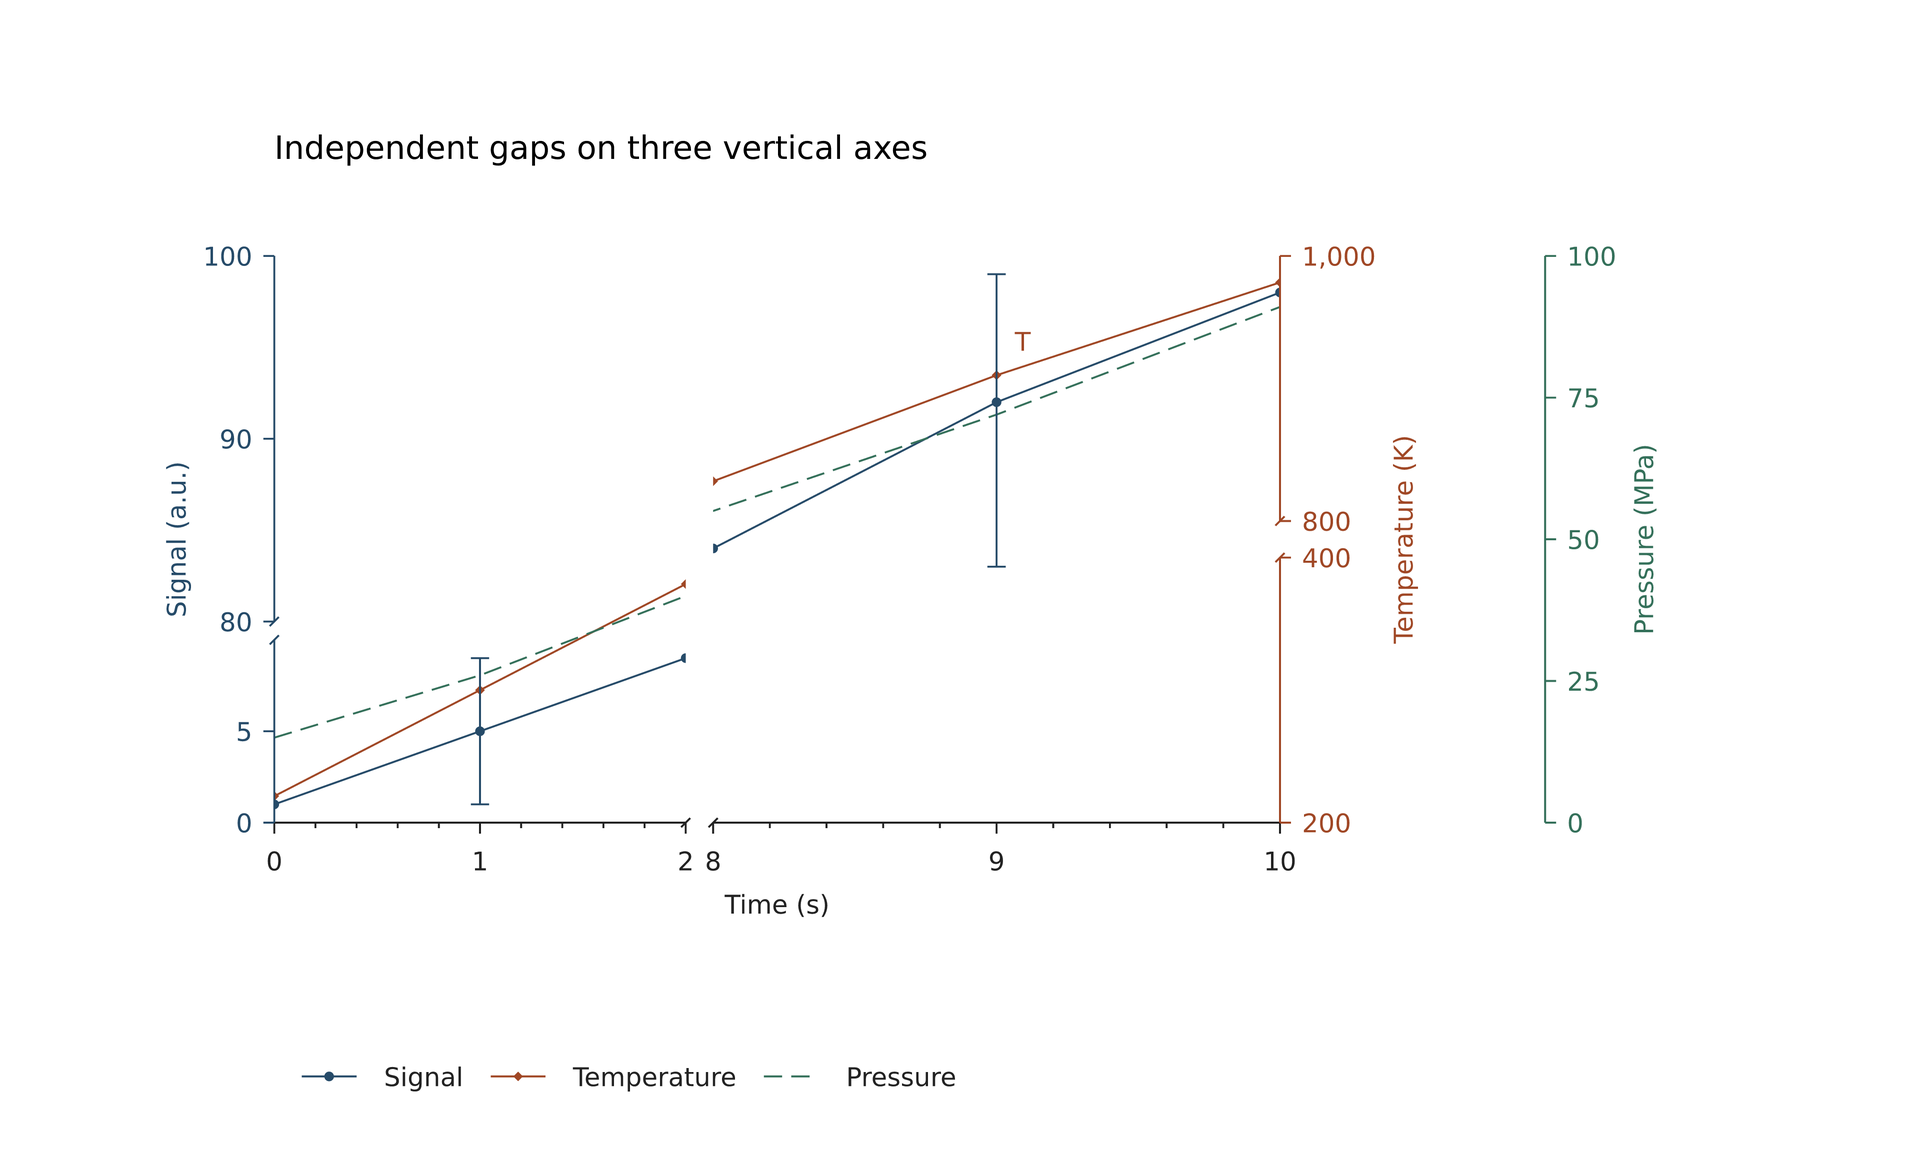
# Independent axis gaps. Lengths are literal mm, not stretch factors.page=canvas(size=(210 mm,128 mm),background="#ffffff")s=plot_style(font_family="DejaVu Sans",font_size=8 pt)p=plot(size=(195 mm,112 mm),plot_area=box(offset=(24 mm, 20 mm), size=(110 mm, 62 mm)),style=s, x=axis(label="Time (s)",range=(0,10),ticks=[0,1,2,8,9,10],breaks=[(2,8)],break_gap=3 mm,segment_lengths=[45 mm,62 mm],minor_ticks="auto"), y=axis(label="Signal (a.u.)",range=(0,100),ticks=[0,5,80,90,100],breaks=[(10,80)],break_gap=2 mm,segment_lengths=[20 mm,40 mm],line_color="#264b69"))p.add_axis(name="temperature",side= right,offset=0 mm, axis=axis(label="Temperature (K)",range=(200,1000),ticks=[200,400,800,1000],breaks=[(400,800)],break_gap=4 mm,segment_lengths=[29 mm,29 mm],line_color="#a04725"))p.add_axis(name="pressure",side= right,offset=29 mm, axis=axis(label="Pressure (MPa)",range=(0,100),ticks=[0,25,50,75,100],line_color="#34705a"))a=p.line(x=[0,1,2,8,9,10],y=[1,5,9,84,92,98],marker= circle,color="#264b69",label="Signal")b=p.line(x=[0,1,2,8,9,10],y=[220,300,380,830,910,980],y_axis="temperature",marker= diamond,color="#a04725",label="Temperature")c=p.line(x=[0,1,2,8,9,10],y=[15,26,40,55,72,91],y_axis="pressure",line_dash=[2 mm,1 mm],color="#34705a",label="Pressure")p.errorbar(x=[1,9],y=[5,91],yerr=[4,8],color="#264b69",cap_size=2 mm)chart=page.add(p,offset=(6 mm,8 mm))page.add(text(content="Independent gaps on three vertical axes",font_family="DejaVu Sans",font_size=10 pt),target=chart.plot_top_left,offset=(0 mm,-14 mm))page.add(legend(layers=[a,b,c],columns=3,gap=3 mm,background="none"),target=chart.plot_bottom_left,offset=(0 mm,23 mm))# This data anchor uses temperature values, including its independent break.page.add(text(content="T",font_family="DejaVu Sans",font_size=8 pt,color="#a04725"),anchor=bottom_left,target=chart.data(x=9,y=910,y_axis="temperature"),offset=(2 mm,-2 mm))# BEGIN DEMO# Independent axis gaps. Lengths are literal mm, not stretch factors.page=canvas(size=(210 mm,128 mm),background="#ffffff")s=plot_style(font_family="DejaVu Sans",font_size=8 pt)p=plot(size=(195 mm,112 mm),plot_area=box(offset=(24 mm, 20 mm), size=(110 mm, 62 mm)),style=s, x=axis(label="Time (s)",range=(0,10),ticks=[0,1,2,8,9,10],breaks=[(2,8)],break_gap=3 mm,segment_lengths=[45 mm,62 mm],minor_ticks="auto"), y=axis(label="Signal (a.u.)",range=(0,100),ticks=[0,5,80,90,100],breaks=[(10,80)],break_gap=2 mm,segment_lengths=[20 mm,40 mm],line_color="#264b69"))p.add_axis(name="temperature",side= right,offset=0 mm, axis=axis(label="Temperature (K)",range=(200,1000),ticks=[200,400,800,1000],breaks=[(400,800)],break_gap=4 mm,segment_lengths=[29 mm,29 mm],line_color="#a04725"))p.add_axis(name="pressure",side= right,offset=29 mm, axis=axis(label="Pressure (MPa)",range=(0,100),ticks=[0,25,50,75,100],line_color="#34705a"))a=p.line(x=[0,1,2,8,9,10],y=[1,5,9,84,92,98],marker= circle,color="#264b69",label="Signal")b=p.line(x=[0,1,2,8,9,10],y=[220,300,380,830,910,980],y_axis="temperature",marker= diamond,color="#a04725",label="Temperature")c=p.line(x=[0,1,2,8,9,10],y=[15,26,40,55,72,91],y_axis="pressure",line_dash=[2 mm,1 mm],color="#34705a",label="Pressure")p.errorbar(x=[1,9],y=[5,91],yerr=[4,8],color="#264b69",cap_size=2 mm)chart=page.add(p,offset=(6 mm,8 mm))page.add(text(content="Independent gaps on three vertical axes",font_family="DejaVu Sans",font_size=10 pt),target=chart.plot_top_left,offset=(0 mm,-14 mm))page.add(legend(layers=[a,b,c],columns=3,gap=3 mm,background="none"),target=chart.plot_bottom_left,offset=(0 mm,23 mm))# This data anchor uses temperature values, including its independent break.page.add(text(content="T",font_family="DejaVu Sans",font_size=8 pt,color="#a04725"),anchor=bottom_left,target=chart.data(x=9,y=910,y_axis="temperature"),offset=(2 mm,-2 mm))# END DEMOPreview
Dependencies
examples/plot/multi-axes-breaks.lay
Common errors and limits#
log requires positive bounds and valid data. Explicit tick_text must match ticks. axis.min/max mean numerical domain endpoints, including on reversed axes.
Individual functions#
axis#
Configure data domain, linear/log/symlog mapping, ticks, labels and breaks. Domains use original values; text/stroke dimensions are physical.
Returns: axis
Minimal complete source · Composition source · All parameters
Detailed behavior and further examples#
Parameters#
| Parameter | Purpose | Default or requirement |
|---|---|---|
range |
Data range | May be explicit |
minor_ticks |
Minor ticks | []; explicitly enable auto |
reverse |
Reverse display | false |
Common usage#
The primary names are x/y. Added names must be nonempty and unique. side="left|right|top|bottom" defaults to right. offset=0 mm is measured outward from the corresponding data edge; negative values are allowed. Axes on the same side do not push one another apart. Every layer accepts x_axis/y_axis (defaults x/y), rejecting missing names and wrong directions. Each automatic domain uses only its own bound data; an unused axis needs an explicit range.
chart.data(...) uses original values with the selected axes' transforms, reversal and segments. chart.axis(name=...,anchor="start|center|end") uses the domain minimum/maximum for start/end even on a reversed axis. Center is the physical midpoint, possibly within a gap. Both kinds of anchors follow instance rotation and group scaling. Placement offsets use the surrounding page or group's coordinate system.
| Axis option | Behavior |
|---|---|
reverse=false |
Reverse display, preserving input data and statistics |
scale="symlog", constant=1 |
Transform sign(x)*log(1+abs(x)/constant); positive constant in original data units, allowing zero and negatives |
tick_text=[...] |
Strings, text or formula definitions; requires equally long explicit ticks, in input order |
tick_rotation=0 deg |
Rotate around each label center; placement measures rotated bounds |
tick_offset=(0 mm,0 mm) |
Local physical offset, right/down positive |
tick_font_size=..., tick_color="#..." |
Independent tick and multiplier styles; tick marks also use tick_color. Explicit text/formula asset styles remain intact |
line_color="#...", line_width=... |
Axis line/default text color and physical stroke width; tick_color can override tick color |
spine=false |
Hide the spine and its break marks while retaining ticks and labels |
minor_ticks="auto" |
Opt in; subdivide numeric intervals into fifths for linear/symlog axes, or decimal 2–9 ticks for log axes. Original default remains an empty list |
| `grid="none | major |
Existing label_offset/exponent_offset remain independent. Categories require explicit numeric positions and tick_text; neither category order nor axis selection is inferred.
Limits and related topics#
Data input and missing values · Plot area and physical size · Labels and scientific notation · Legends and shared colorbars · Data anchors and annotations