 LayMesh
First Plot
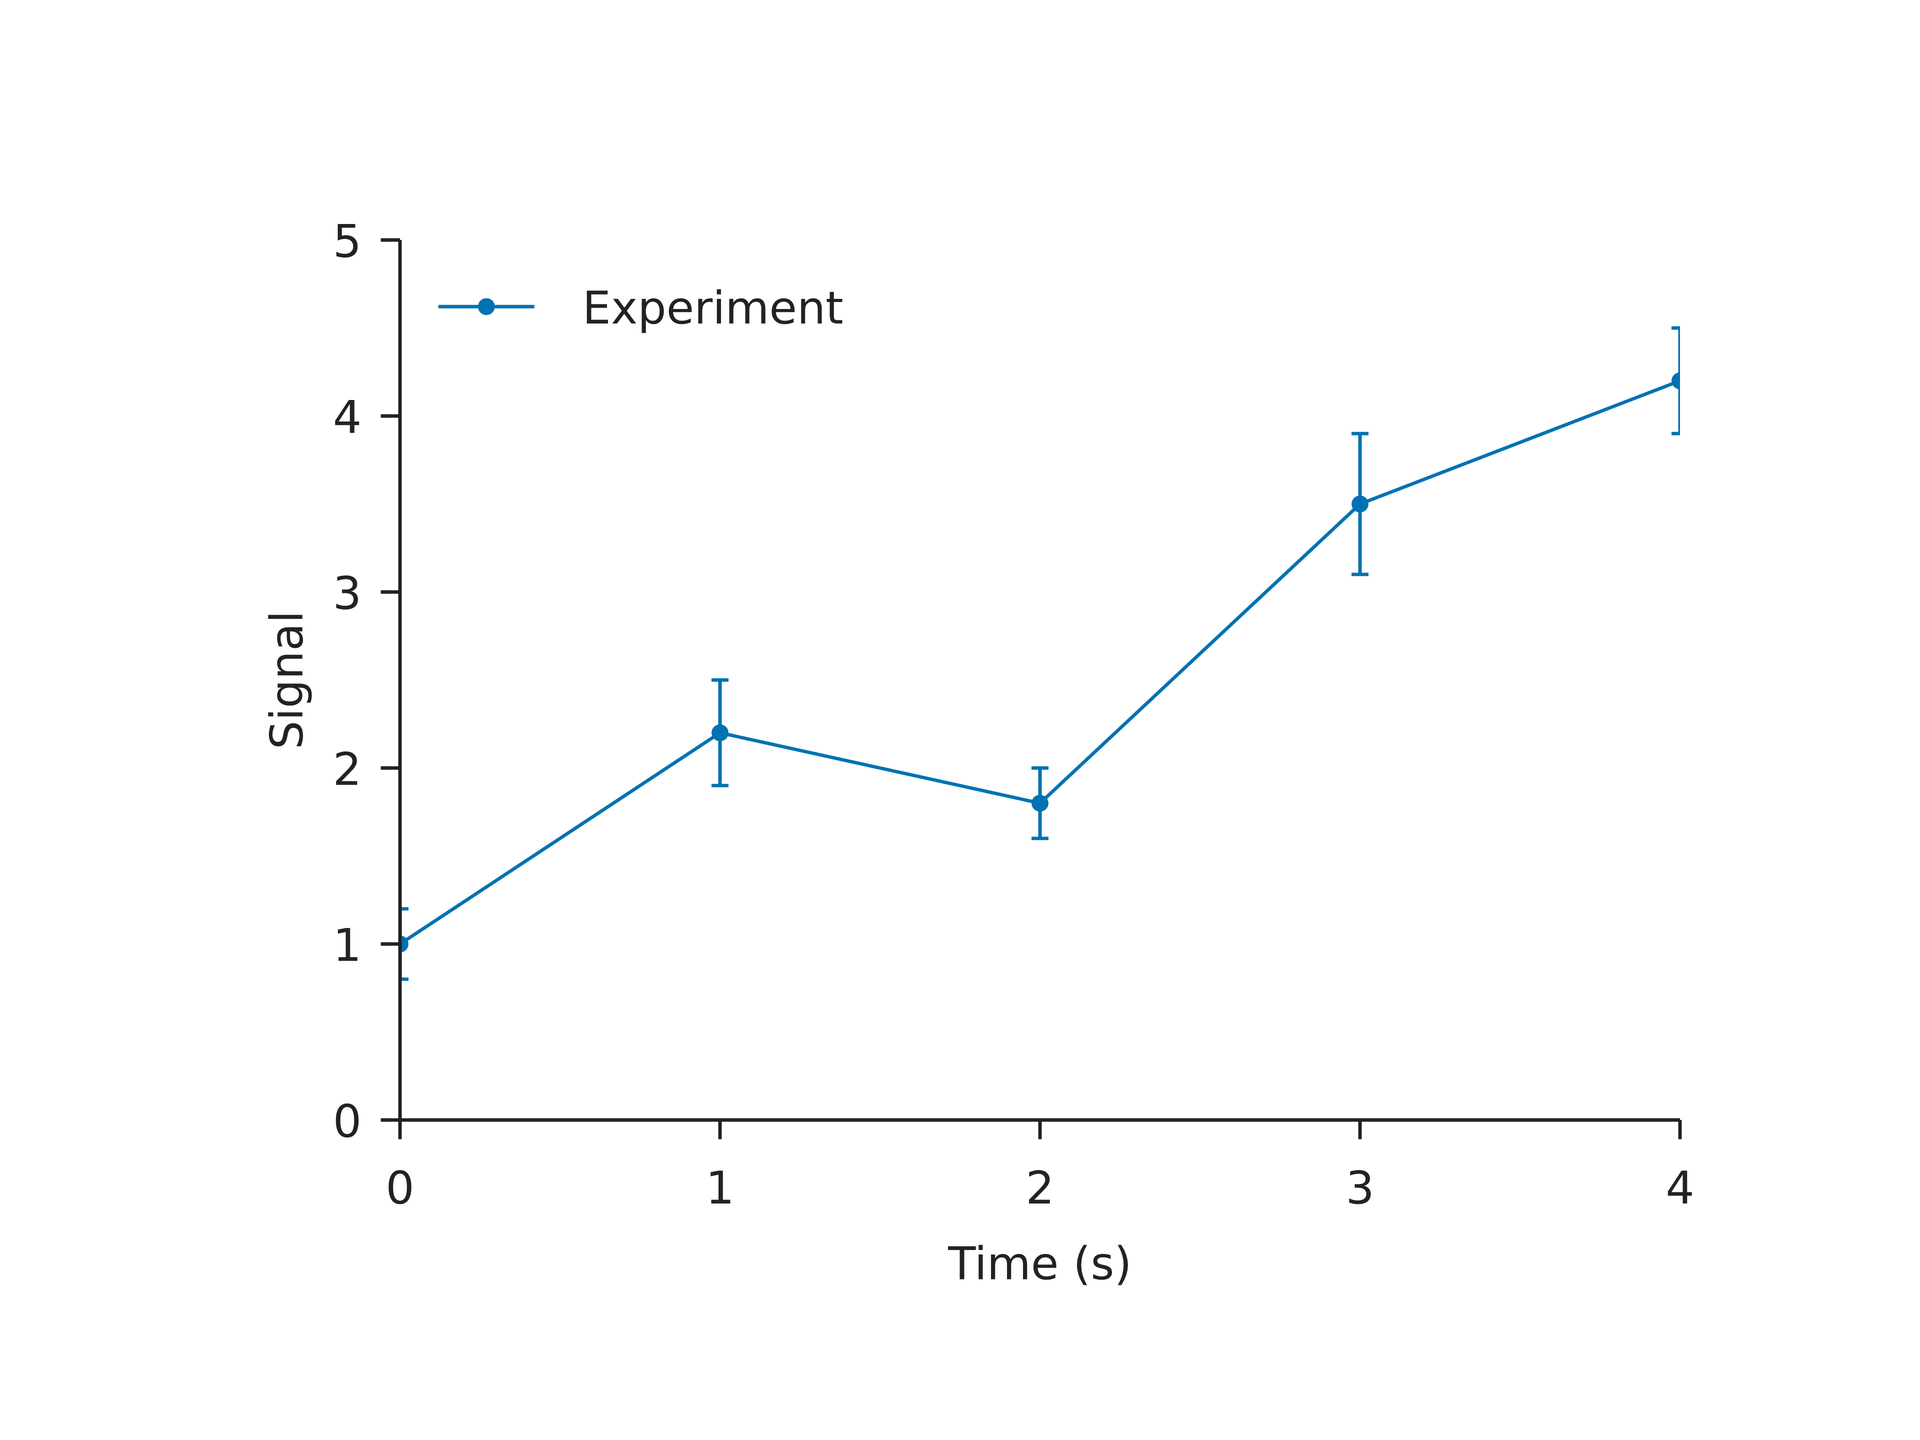
page = canvas(size=(120 mm, 90 mm), background="#ffffff")d = table(src="first-plot.csv")s = plot_style(font_family="DejaVu Sans", font_size=8 pt)p = plot(size=(110 mm, 80 mm), plot_area=box(offset=(20 mm, 10 mm), size=(80 mm, 55 mm)), x=axis(label="Time (s)", range=(0, 4)), y=axis(label="Signal", range=(0, 5)), style=s)p.line(x=d["time"], y=d["signal"], marker= circle, color="#0072B2", label="Experiment")p.errorbar(x=d["time"], y=d["signal"], yerr=d["error"], color="#0072B2")p.legend(position= top_left)chart = page.add(p, offset=(5 mm, 5 mm))page = canvas(size=(120 mm, 90 mm), background="#ffffff")d = table(src="first-plot.csv")s = plot_style(font_family="DejaVu Sans", font_size=8 pt)p = plot(size=(110 mm, 80 mm), plot_area=box(offset=(20 mm, 10 mm), size=(80 mm, 55 mm)), x=axis(label="Time (s)", range=(0, 4)), y=axis(label="Signal", range=(0, 5)), style=s)p.line(x=d["time"], y=d["signal"], marker= circle, color="#0072B2", label="Experiment")p.errorbar(x=d["time"], y=d["signal"], yerr=d["error"], color="#0072B2")p.legend(position= top_left)chart = page.add(p, offset=(5 mm, 5 mm))time,signal,error0,1.0,0.21,2.2,0.32,1.8,0.23,3.5,0.44,4.2,0.3Preview
Background
Dependencies
examples/plot/first-plot.csvexamples/plot/first-plot.lay
Reproduce
laymesh validate examples/plot/first-plot.laylaymesh render examples/plot/first-plot.lay -o figure.svglaymesh render examples/plot/first-plot.lay -o figure.pdflaymesh render examples/plot/first-plot.lay -o figure.png --dpi 300