LayMesh
Actual Matplotlib and Notebook output#
scripts/build-notebook-gallery.py uses the real Python bridge to generate both examples, saving expanded .lay source, plot assets, and final PNG pages. The same {{fig}} binding works in a Notebook; see the interactive example. Both pages measure 120 × 80 mm and render at 709 × 472 px at 150 DPI.
Line plot: SVG vector asset#
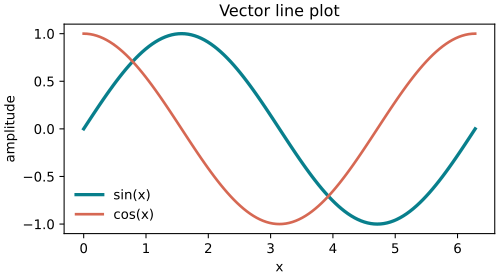
Matplotlib draws two curves with plot; the bridge saves a compatible SVG asset. The plot title and curves come from Matplotlib, while LayMesh positions the footer text.
x = np.linspace(0, 2 * np.pi, 121)ax.plot(x, np.sin(x), label="sin(x)")ax.plot(x, np.cos(x), label="cos(x)")render_source(SOURCE, namespace={"fig": fig, "caption": "Vector plot"}, output="vector-preview.png", dpi=150, save_source="vector.lay")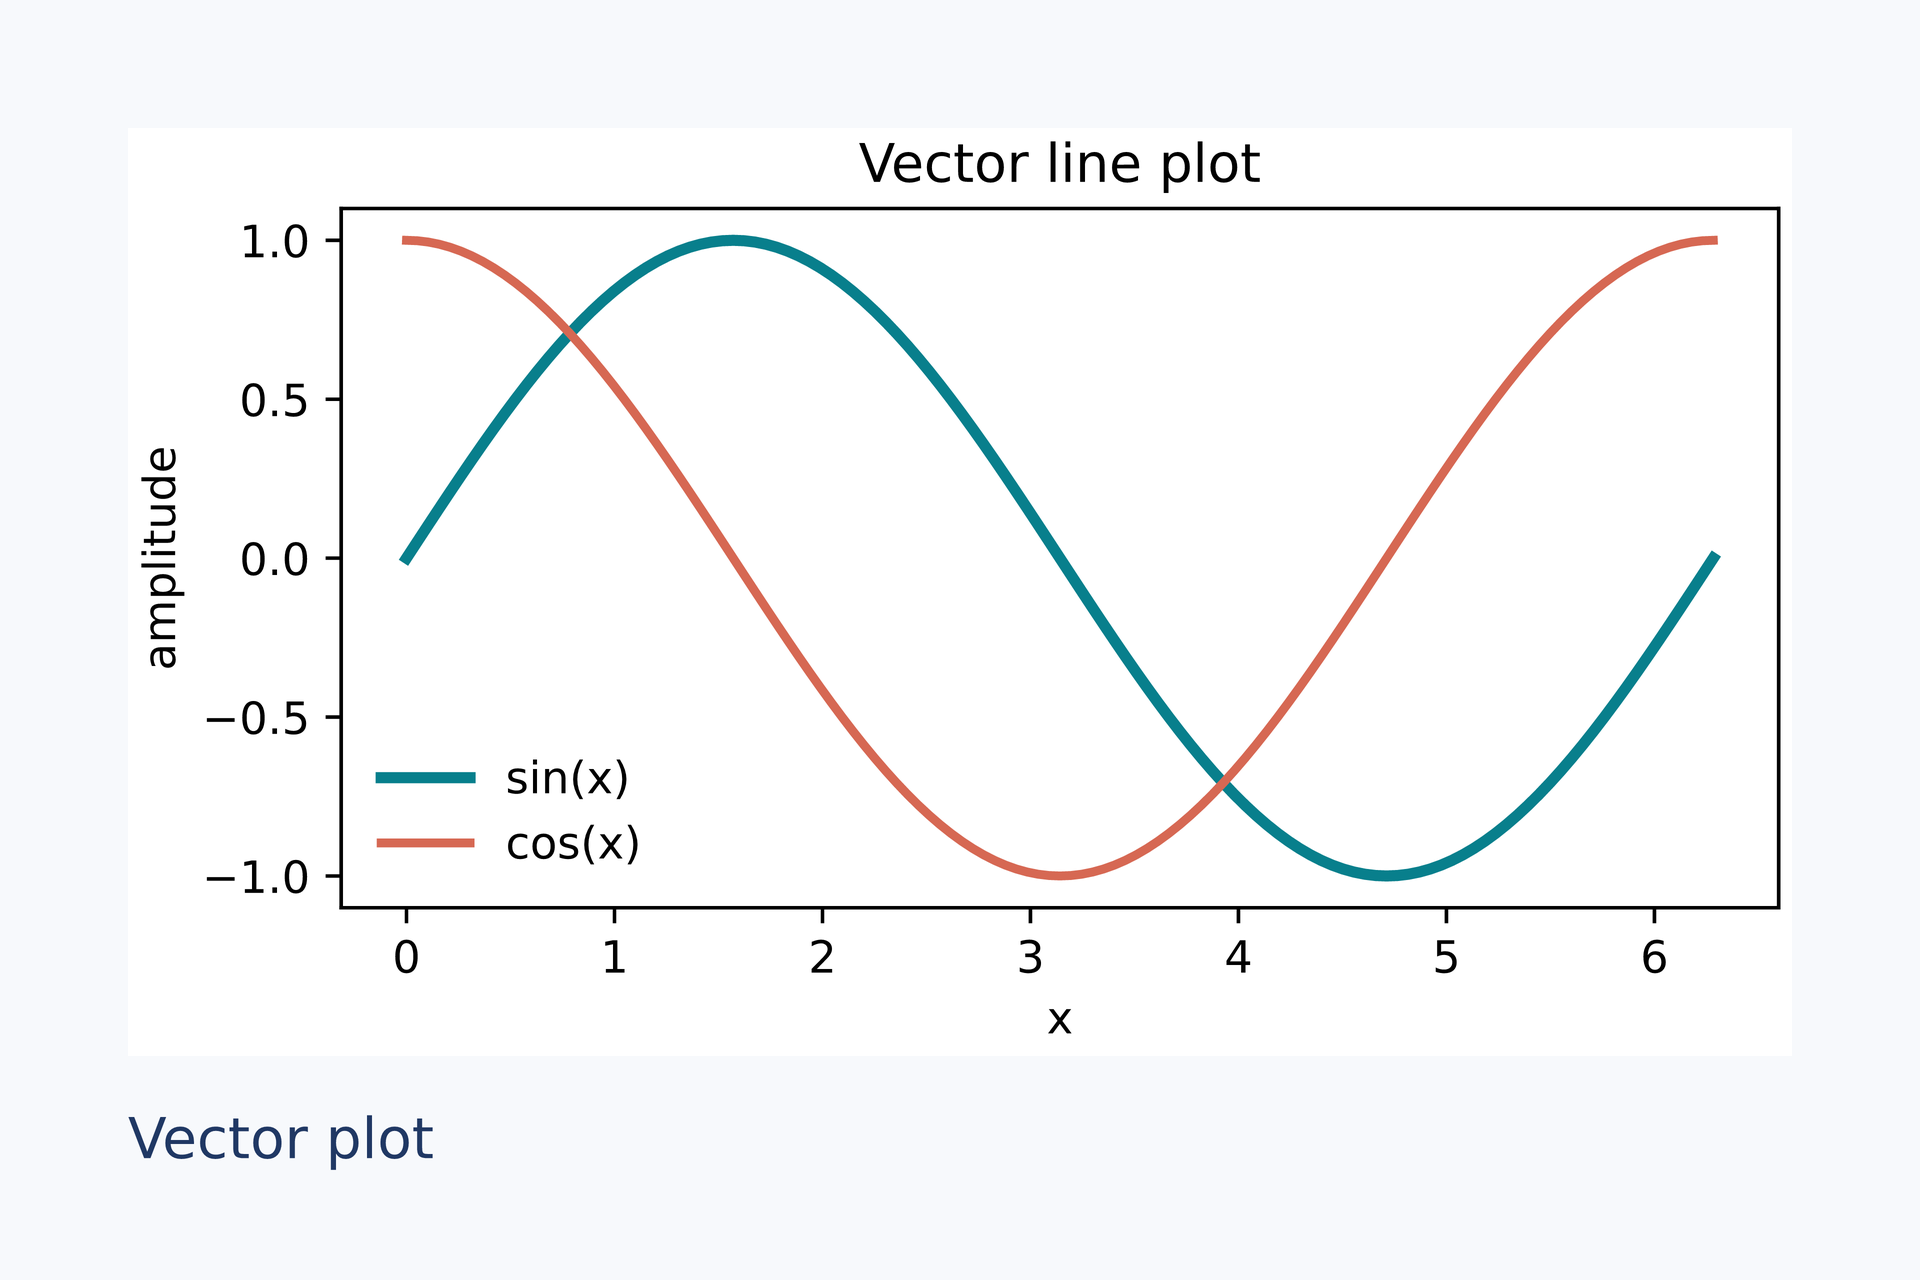
The expanded layout and SVG asset are stored in the repository. Reproduce with python scripts/build-notebook-gallery.py --write. Observed: .svg asset retained, no fallback warning, final page 709 × 472 px. Curves remain vector paths; Matplotlib's text is converted to paths by default.
Heatmap: automatic PNG fallback#
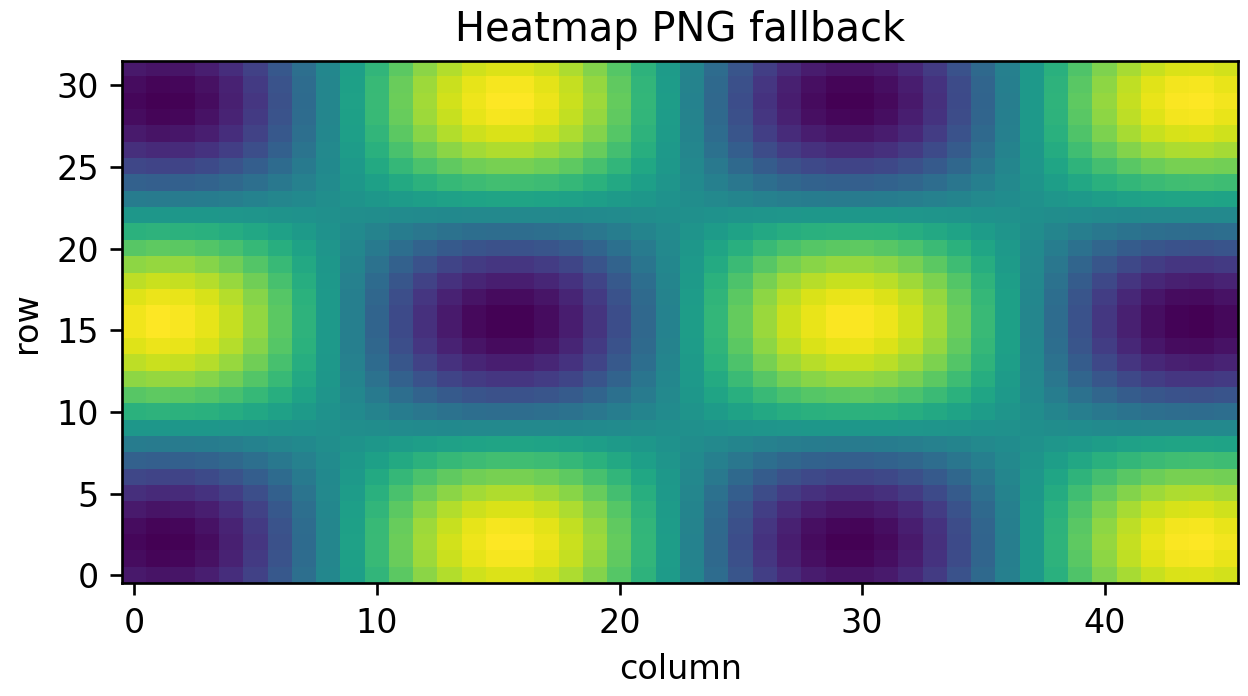
When imshow creates raster content outside LayMesh's current safe SVG subset, the bridge stores a PNG asset at plot_dpi=240, then LayMesh renders the final page at dpi=150. These two DPI settings control the chart asset and the final page independently.
z = np.sin(x[None, :] * 2) * np.cos(y[:, None] * 2)ax.imshow(z, cmap="viridis", origin="lower", aspect="auto")render_source(SOURCE, namespace={"fig": fig, "caption": "Heatmap fallback"}, output="heatmap-preview.png", dpi=150, plot_dpi=240, save_source="heatmap.lay")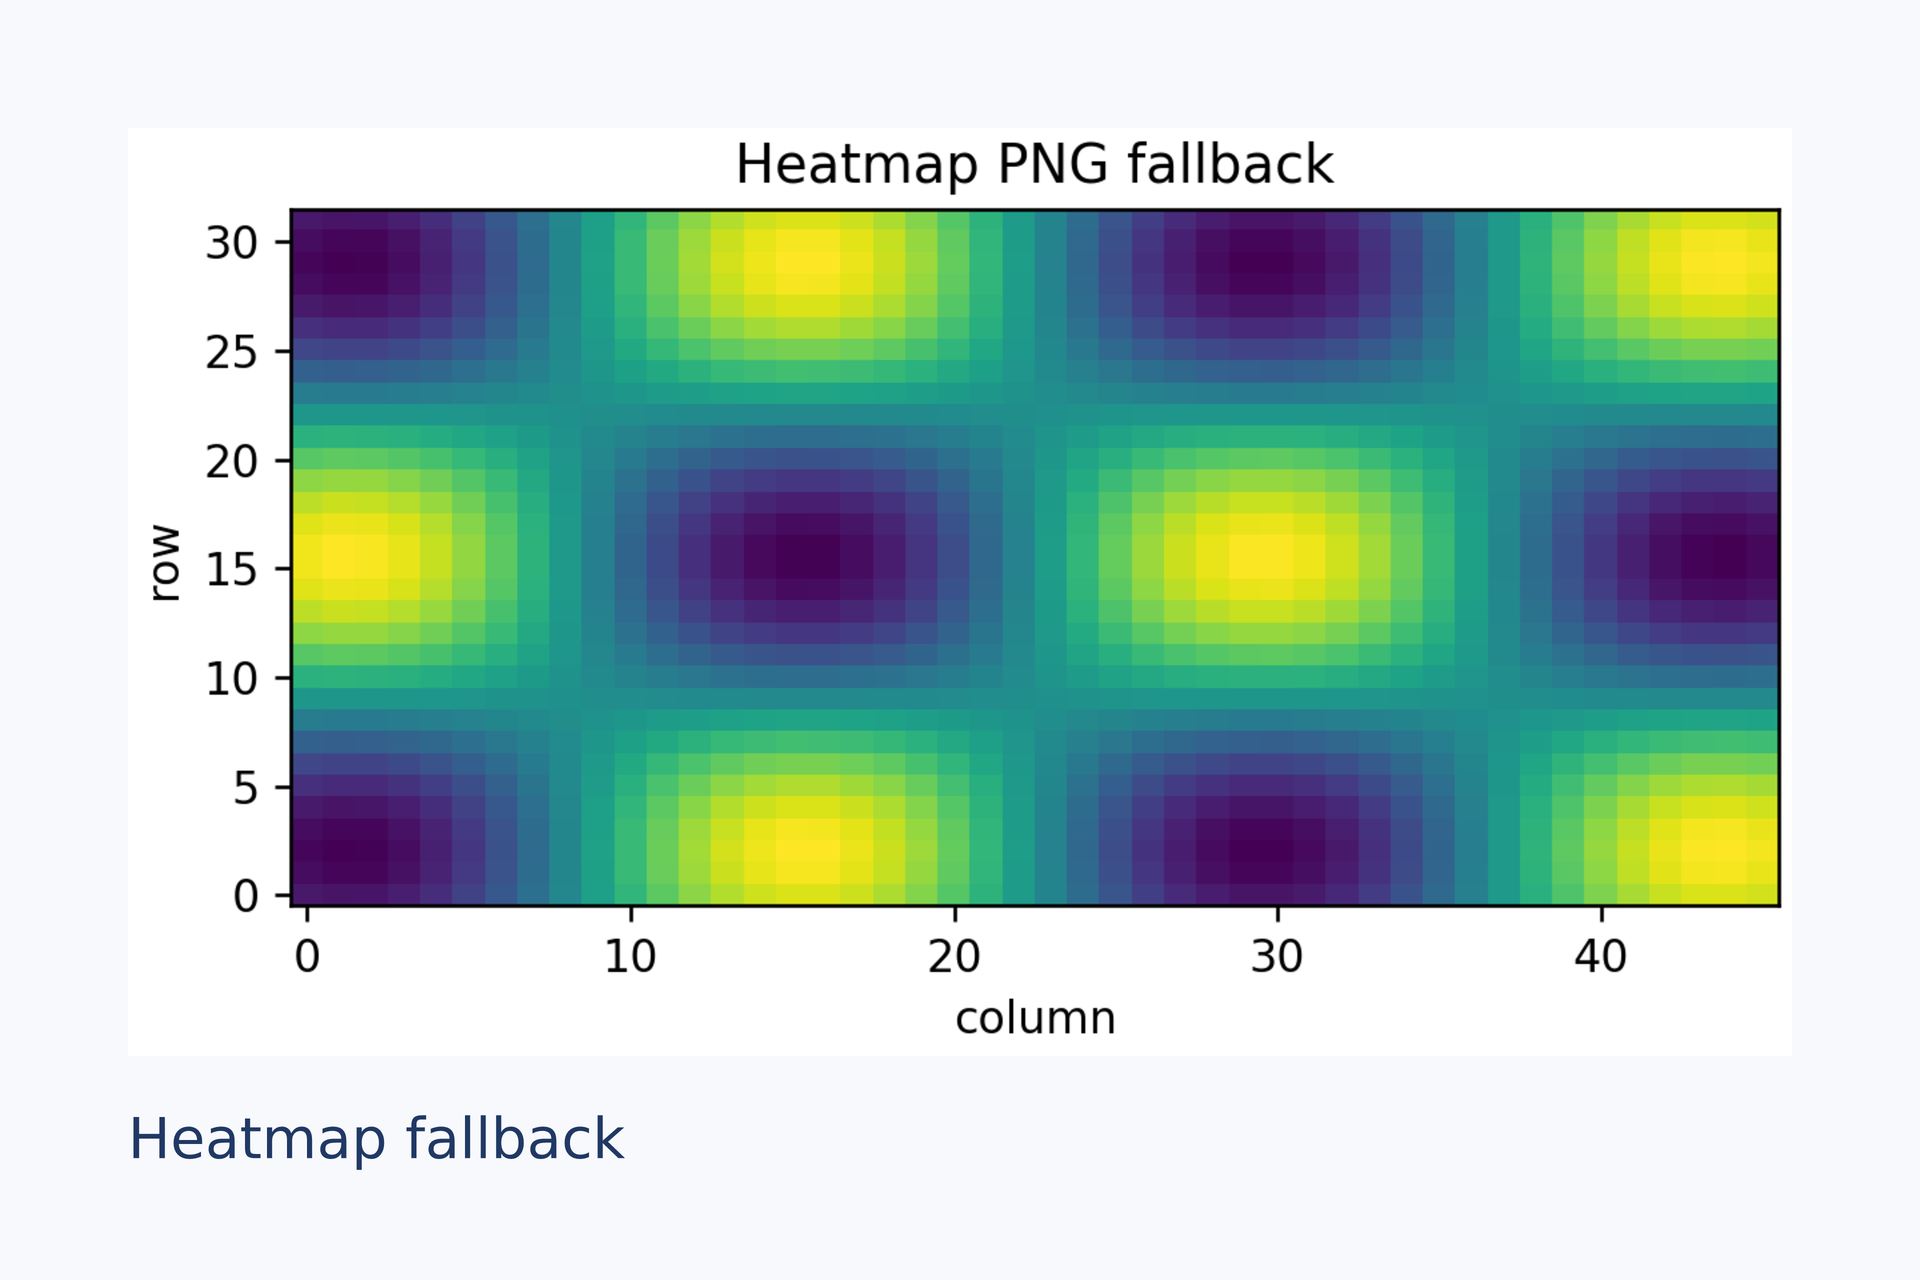
The expanded layout and PNG asset are stored in the repository. Reproduce with python scripts/build-notebook-gallery.py --write. The observed warning is Matplotlib 图 fig 已改用 240 DPI PNG:SVG 使用了当前 LayMesh 不支持的图形内容 (“Figure fig switched to a 240 DPI PNG because its SVG used unsupported content”). The final page is 709 × 472 px.