 LayMesh
定位与图层#
以实例锚点建立关系,再用旋转、透明度和调用顺序决定最终画面。
锚点与依赖#
九点锚点#
同一矩形的九个锚点各放一个圆点,直接展示目标位置。
panel = rect(size=(72 mm, 45 mm), fill="#e6f2f3", border_color="#087f8c", border_width=0.5 mm)placed = page.add(panel, target=page.top_left, offset=(24 mm, 26 mm))dot = ellipse(size=(4 mm, 4 mm), fill="#df6e70")page.add(dot, anchor=center, target=placed.top_left)page.add(dot, anchor=center, target=placed.top_center)page.add(dot, anchor=center, target=placed.top_right)page.add(dot, anchor=center, target=placed.middle_left)page.add(dot, anchor=center, target=placed.center)page.add(dot, anchor=center, target=placed.middle_right)page.add(dot, anchor=center, target=placed.bottom_left)page.add(dot, anchor=center, target=placed.bottom_center)page.add(dot, anchor=center, target=placed.bottom_right)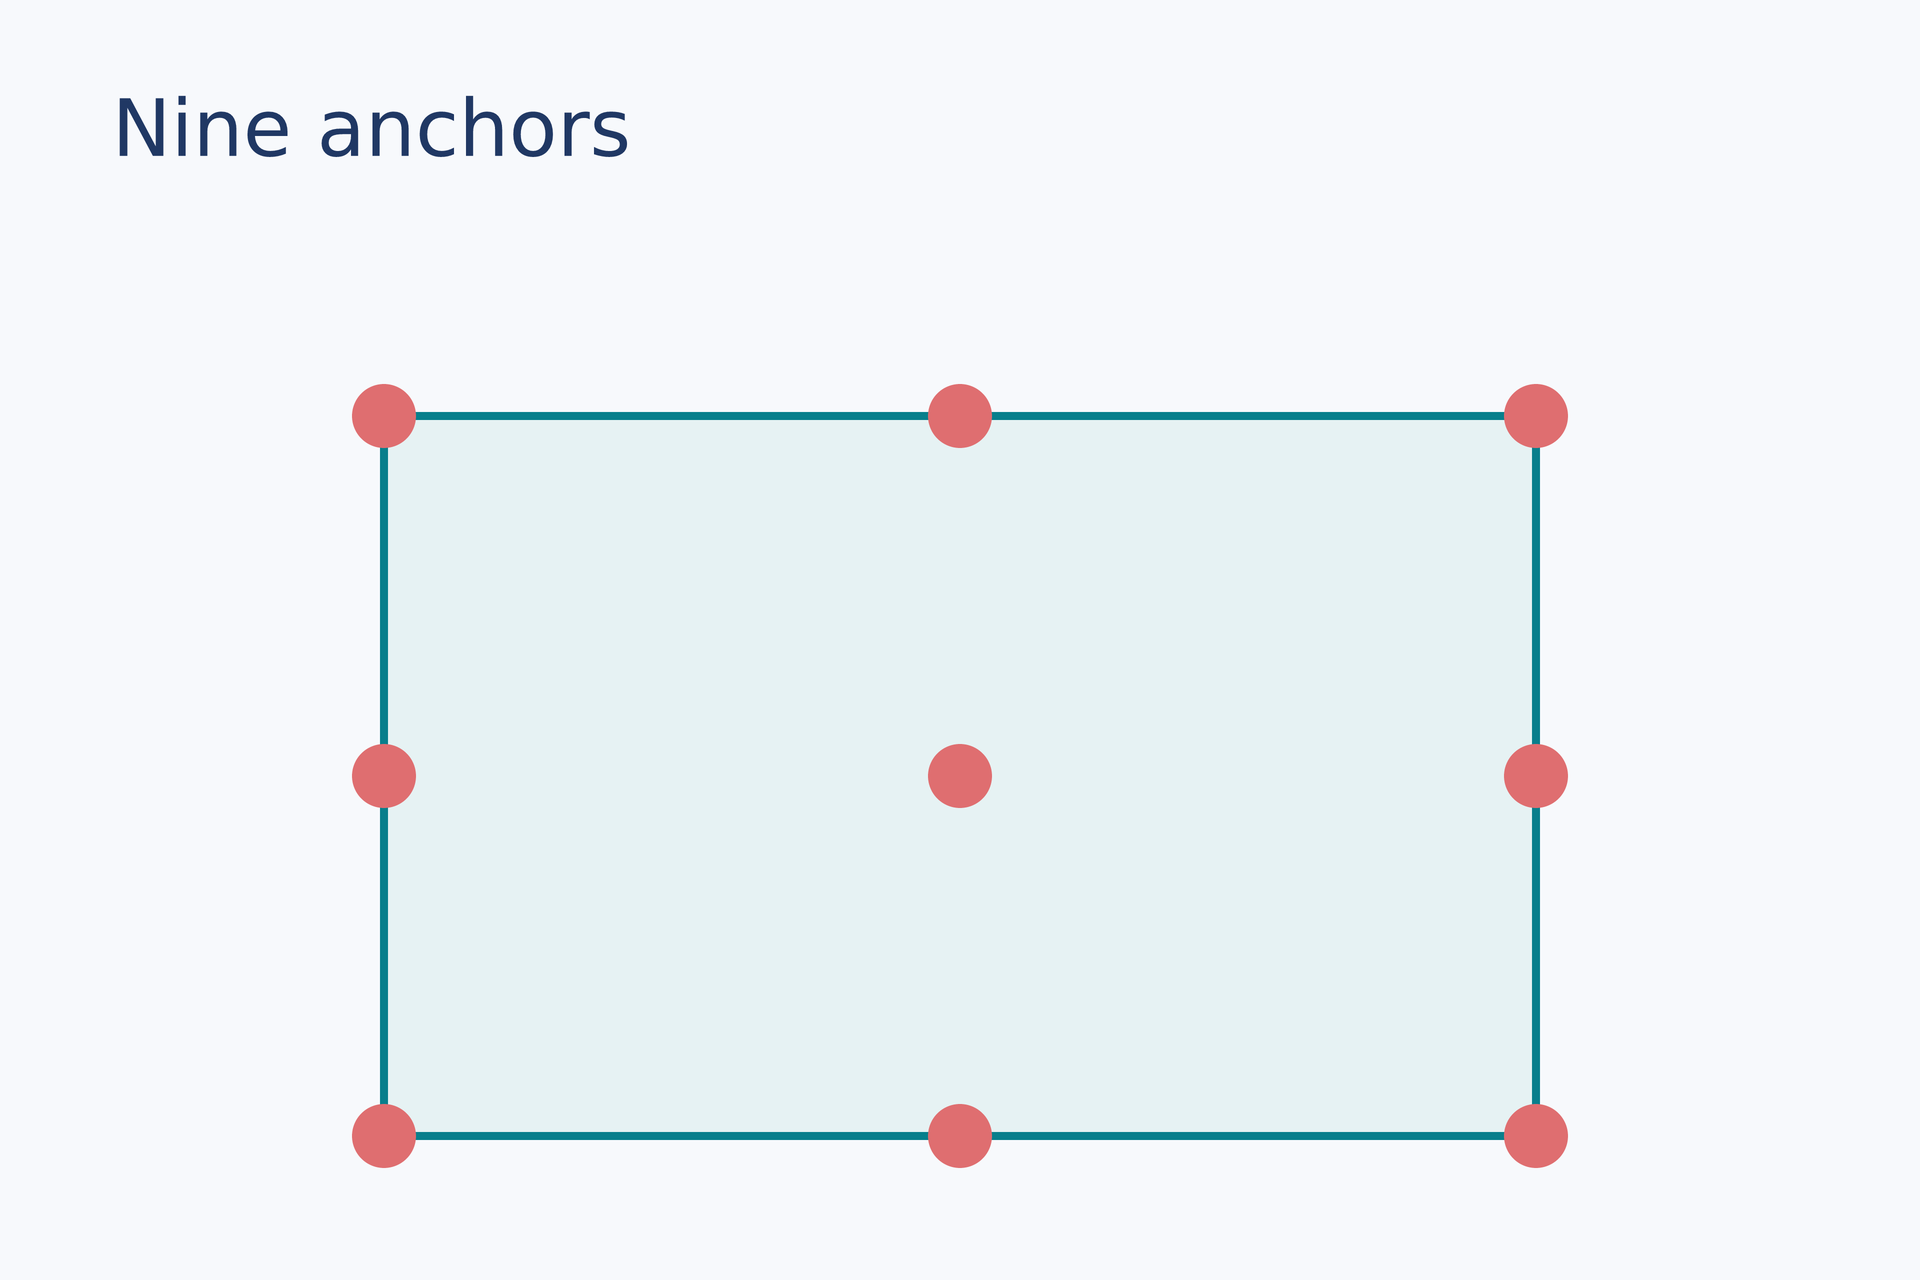
源码:anchors.lay。
复现命令:laymesh validate examples/gallery/positioning/anchors.lay;laymesh render examples/gallery/positioning/anchors.lay -o anchors.png --dpi 150。
实测:有效:examples/gallery/positioning/anchors.lay(120 × 80 mm,11 个顶层实例);PNG 709 × 472 px,150 DPI;警告:无。
相对定位链#
后一个方块以先前实例的锚点为目标,形成可跟随的链。
tile = rect(size=(25 mm, 20 mm), fill="#087f8c")a = page.add(tile, target=page.top_left, offset=(9 mm, 28 mm))b = page.add(tile, target=a.top_right, offset=(7 mm, 0 mm))page.add(tile, target=b.bottom_right, anchor=top_right, offset=(0 mm, 7 mm))
源码:relative.lay。
复现命令:laymesh validate examples/gallery/positioning/relative.lay;laymesh render examples/gallery/positioning/relative.lay -o relative.png --dpi 150。
实测:有效:examples/gallery/positioning/relative.lay(120 × 80 mm,4 个顶层实例);PNG 709 × 472 px,150 DPI;警告:无。
尺寸改变带动定位#
第一个实例的宽度在放置时覆盖;后续对象依据新宽度自动定位。
box = rect(size=(20 mm, 23 mm), fill="#087f8c")first = page.add(box,size=(47 mm, auto), target=page.top_left, offset=(10 mm, 28 mm))follower = page.add(box, target=first.top_right, offset=(6 mm, 0 mm))page.add(text(content="47 mm", font_family=font, font_size=9 pt, color="#ffffff"), anchor=center, target=first.center)page.add(text(content="next", font_family=font, font_size=9 pt, color="#ffffff"), anchor=center, target=follower.center)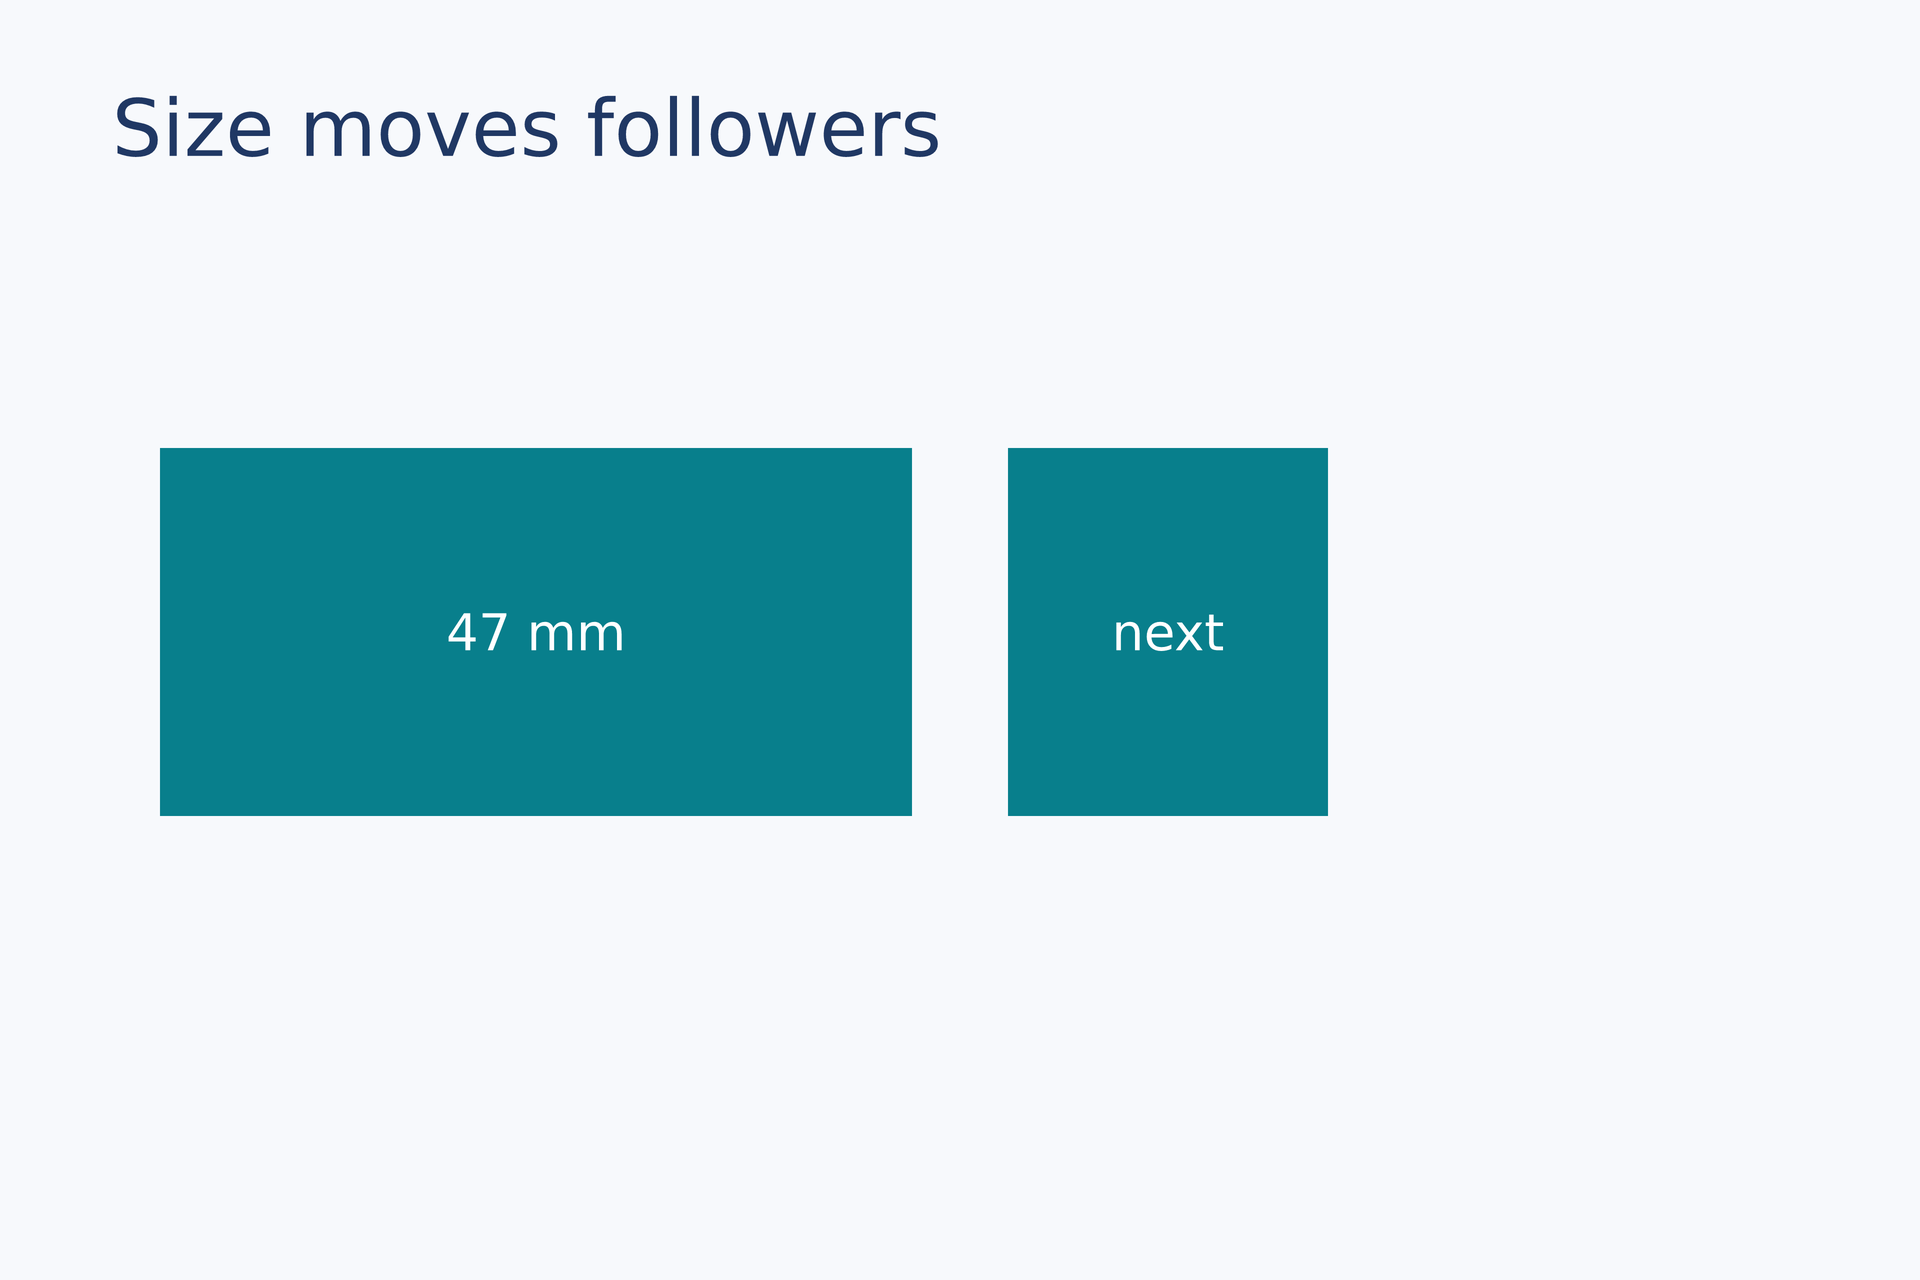
复现命令:laymesh validate examples/gallery/positioning/dependent-size.lay;laymesh render examples/gallery/positioning/dependent-size.lay -o dependent-size.png --dpi 150。
实测:有效:examples/gallery/positioning/dependent-size.lay(120 × 80 mm,5 个顶层实例);PNG 709 × 472 px,150 DPI;警告:无。
实例变换#
旋转#
围绕实例中心旋转矩形,中心标记显示旋转基点。
tile = rect(size=(47 mm, 24 mm), fill="#e4b65f", border_color="#965f32", border_width=0.6 mm)page.add(tile, anchor=center, target=page.center, rotation=27 deg)marker = ellipse(size=(3 mm, 3 mm), fill="#203864")page.add(marker, anchor=center, target=page.center)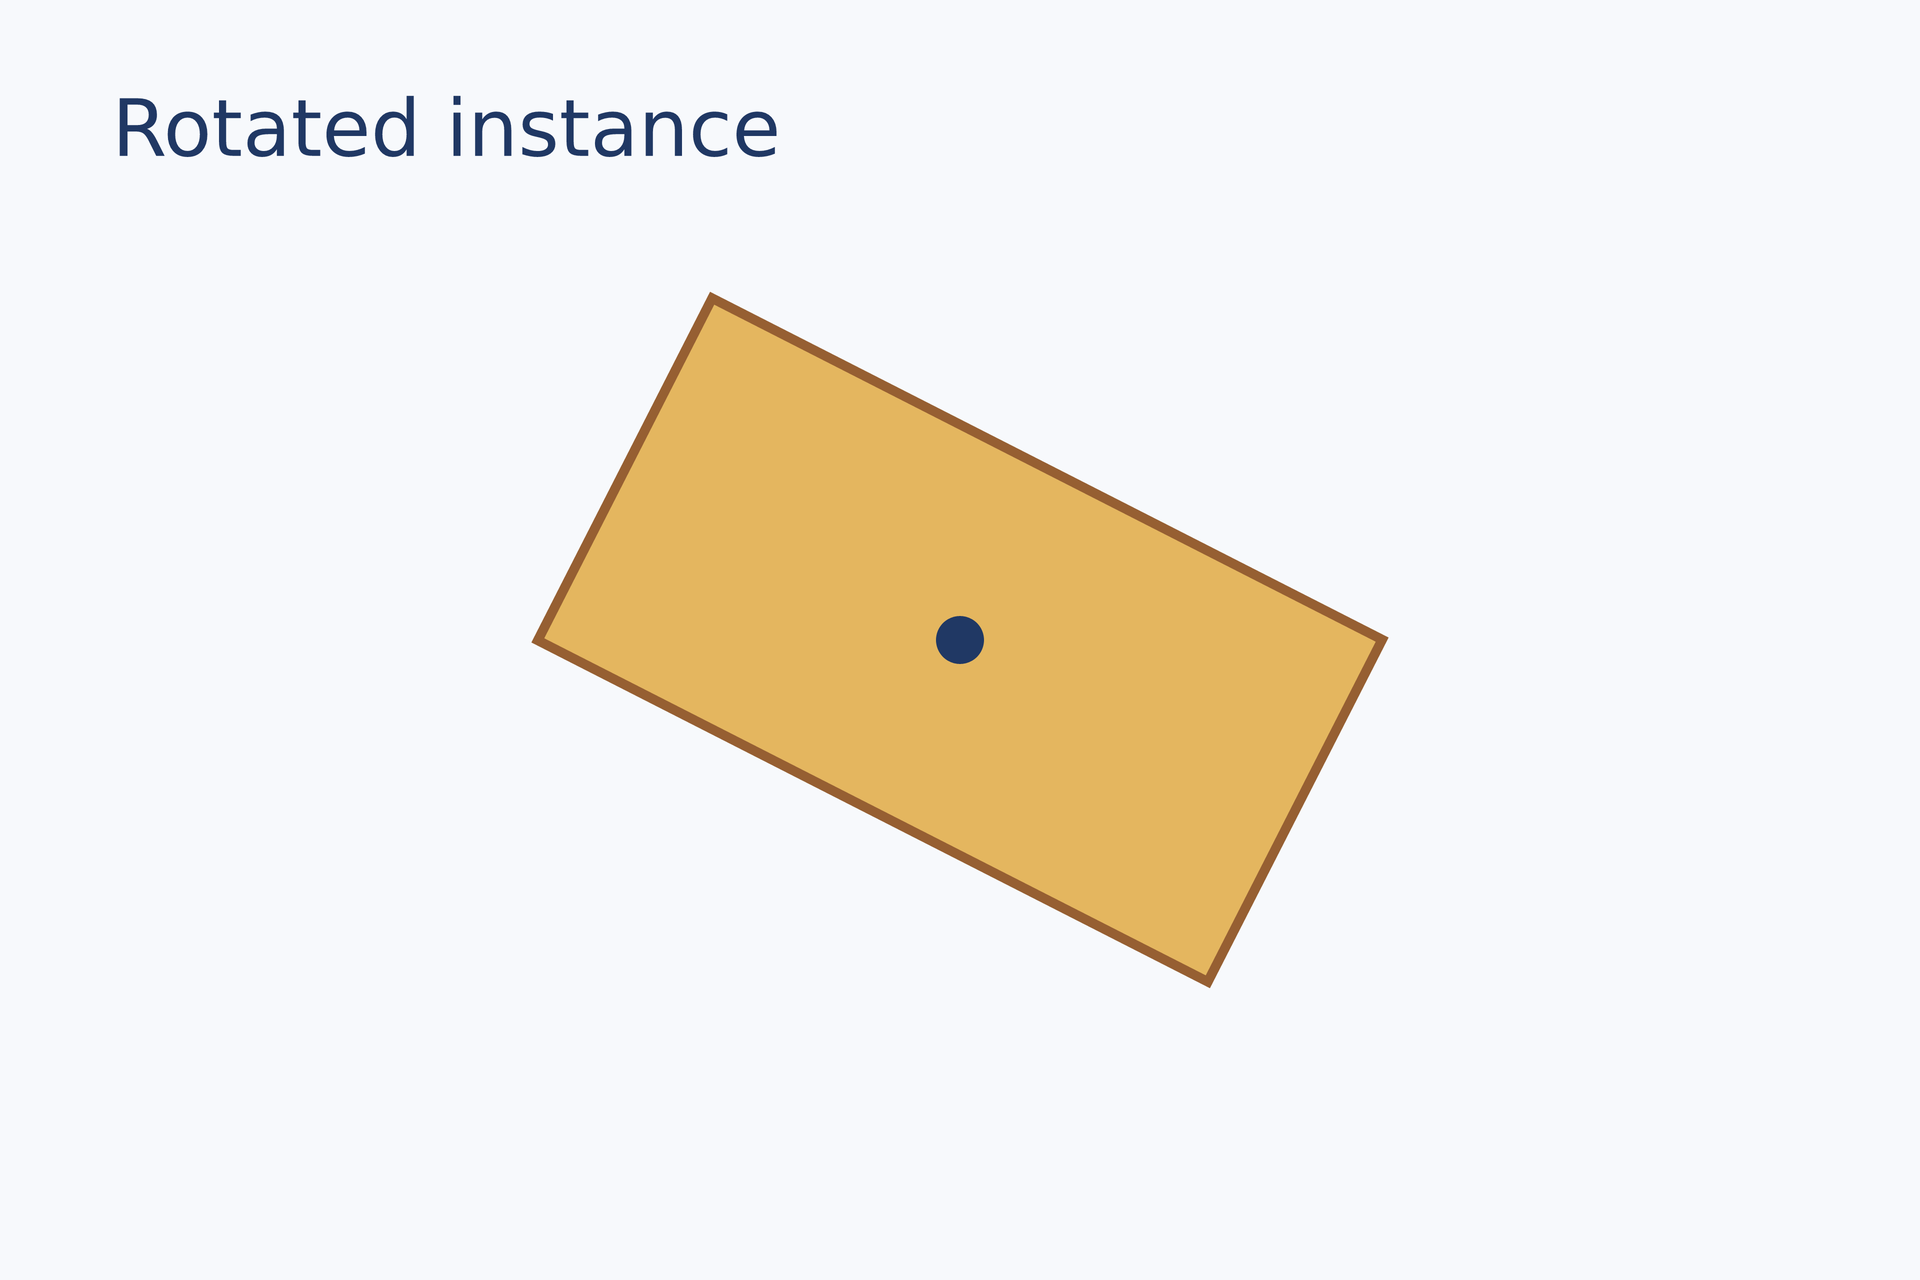
源码:rotation.lay。
复现命令:laymesh validate examples/gallery/positioning/rotation.lay;laymesh render examples/gallery/positioning/rotation.lay -o rotation.png --dpi 150。
实测:有效:examples/gallery/positioning/rotation.lay(120 × 80 mm,3 个顶层实例);PNG 709 × 472 px,150 DPI;警告:无。
透明度#
两个矩形重叠,前景的实例透明度只影响本次放置。
back = rect(size=(50 mm, 36 mm), fill="#087f8c")front = rect(size=(50 mm, 36 mm), fill="#ef755f")page.add(back, target=page.top_left, offset=(19 mm, 27 mm))page.add(front, target=page.top_left, offset=(43 mm, 34 mm), opacity=0.55)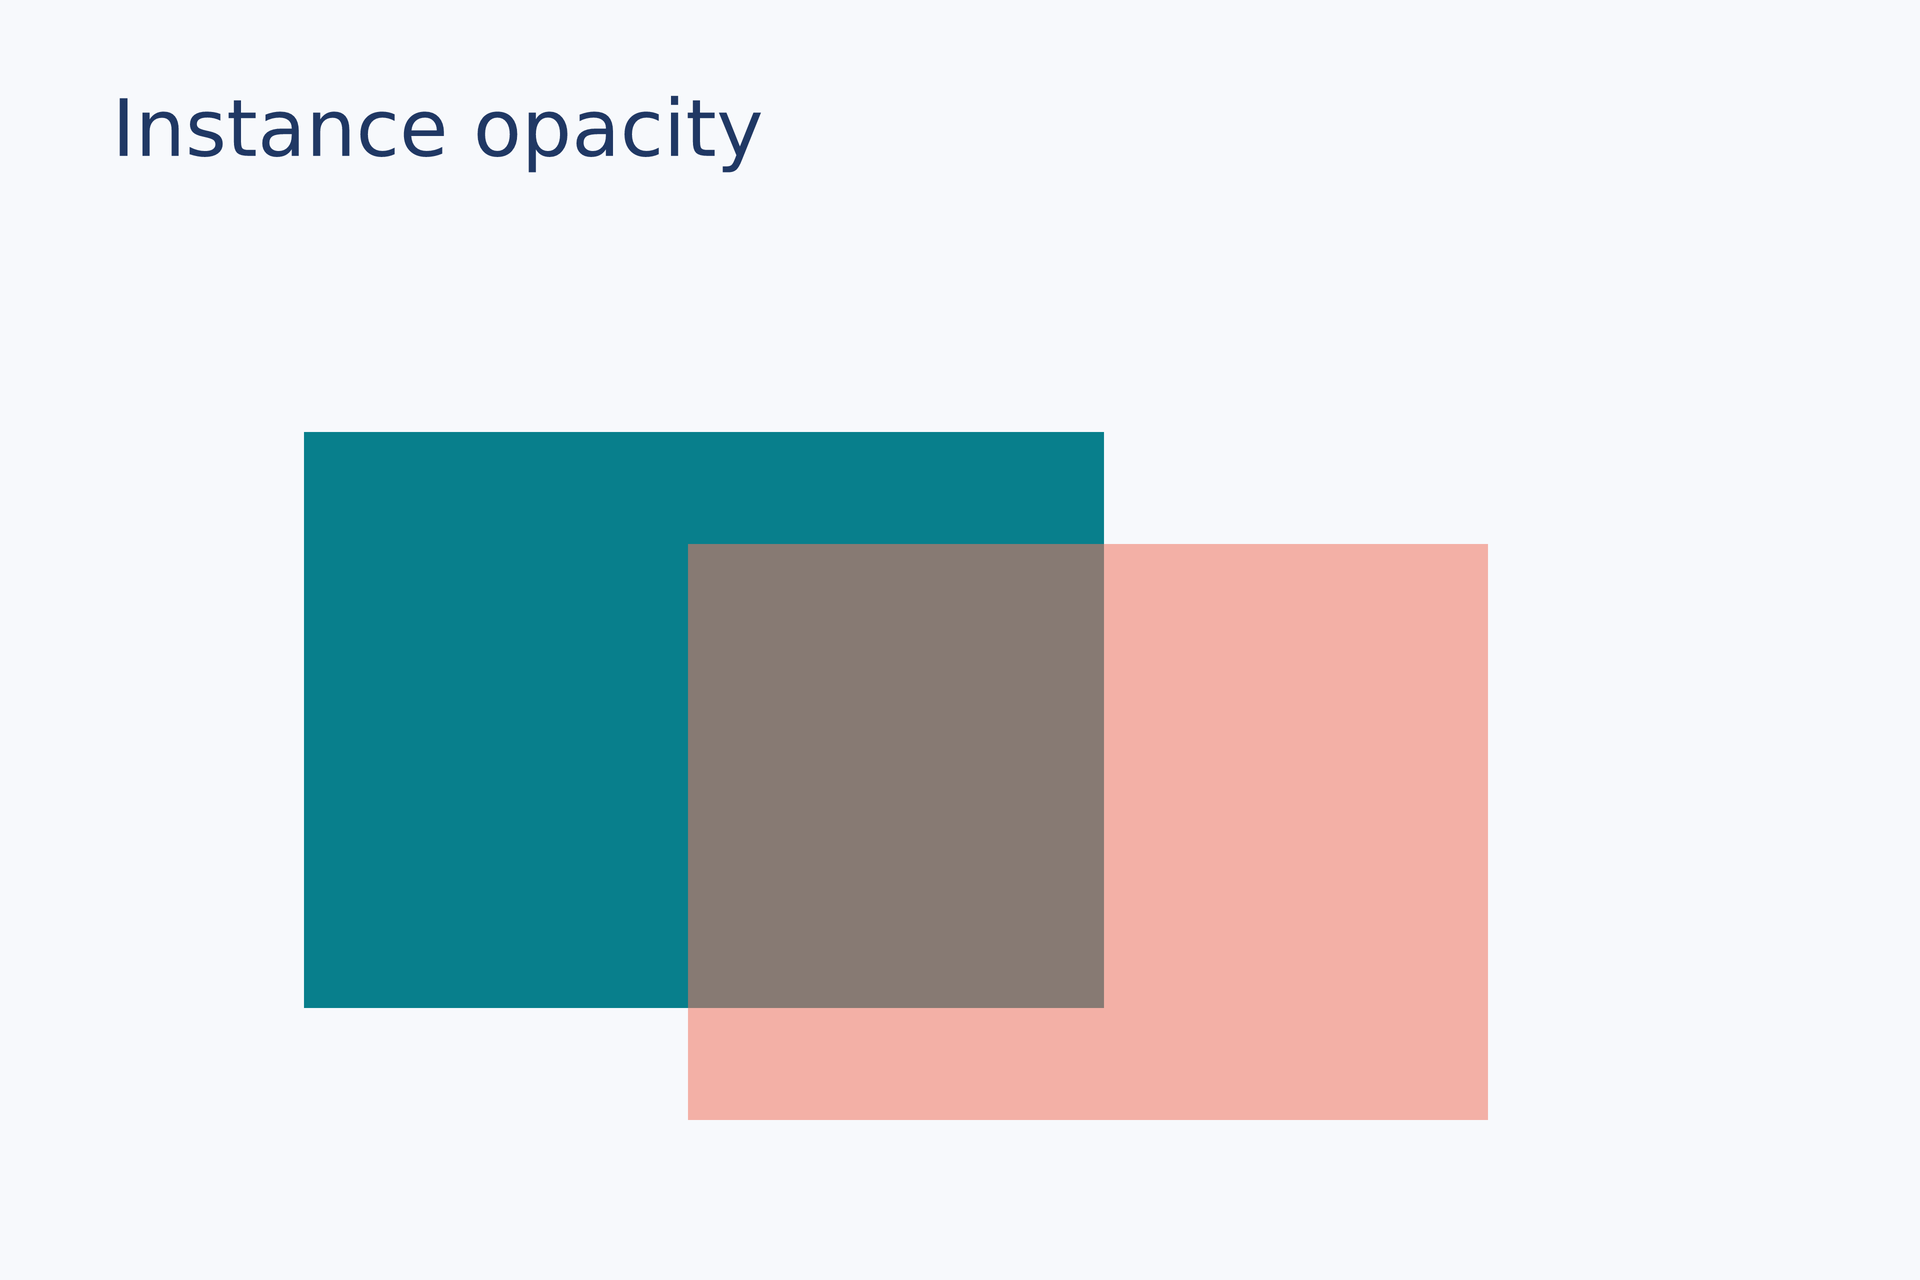
源码:opacity.lay。
复现命令:laymesh validate examples/gallery/positioning/opacity.lay;laymesh render examples/gallery/positioning/opacity.lay -o opacity.png --dpi 150。
实测:有效:examples/gallery/positioning/opacity.lay(120 × 80 mm,3 个顶层实例);PNG 709 × 472 px,150 DPI;警告:无。
绘制顺序#
后执行的 add 调用绘在前面,用不透明重叠块显示层次。
blue = rect(size=(51 mm, 38 mm), fill="#087f8c")orange = rect(size=(51 mm, 38 mm), fill="#f2a545")page.add(blue, target=page.top_left, offset=(16 mm, 27 mm))page.add(orange, target=page.top_left, offset=(48 mm, 34 mm))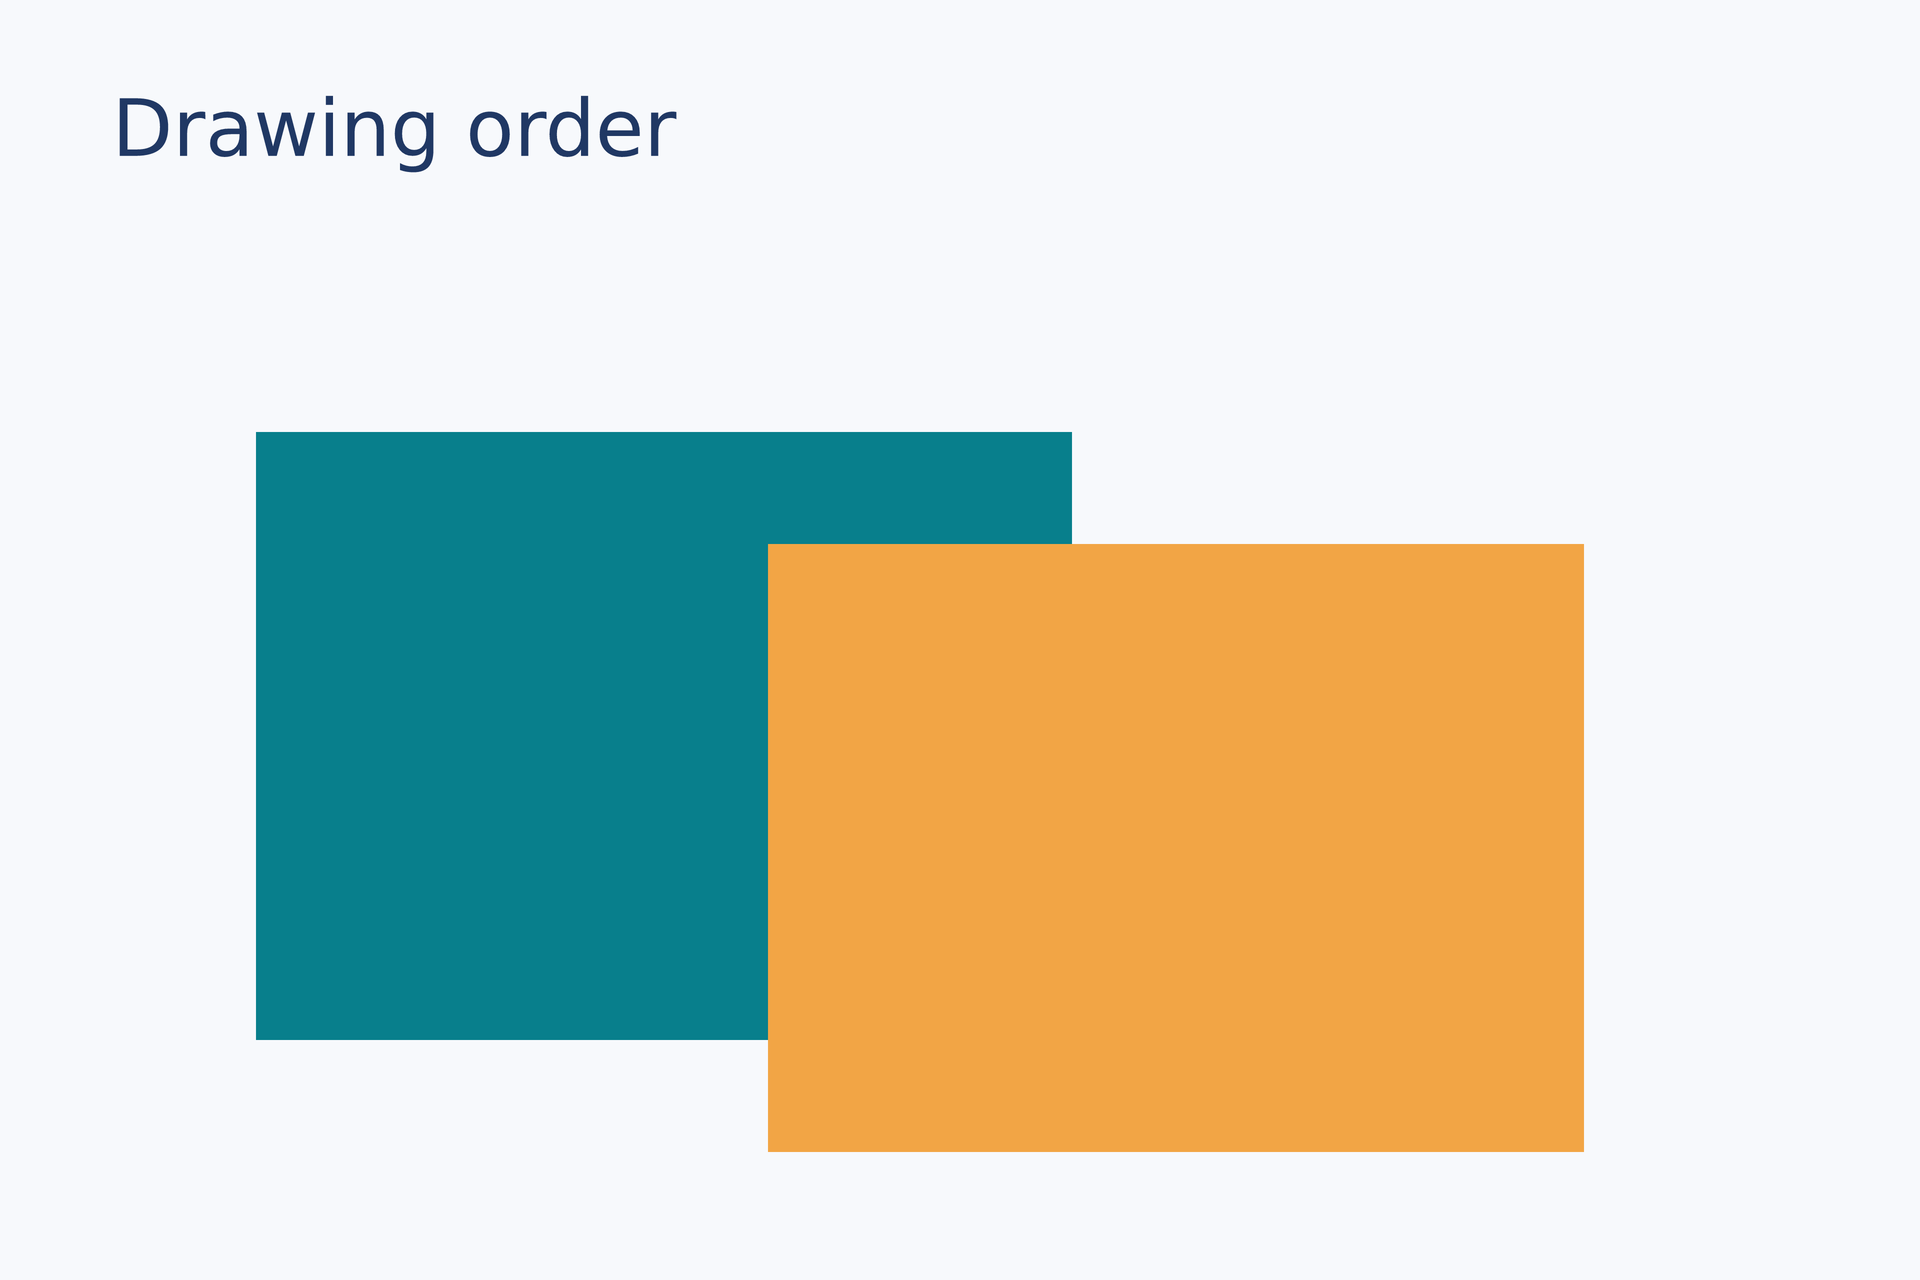
复现命令:laymesh validate examples/gallery/positioning/drawing-order.lay;laymesh render examples/gallery/positioning/drawing-order.lay -o drawing-order.png --dpi 150。
实测:有效:examples/gallery/positioning/drawing-order.lay(120 × 80 mm,3 个顶层实例);PNG 709 × 472 px,150 DPI;警告:无。
几何定位#
框、路径与绘制边界#
在圆角矩形、椭圆和粗箭头上分别选择布局框、几何路径及绘制边缘。
panel = page.add(rect(size=(48mm,32mm),border_radius=9mm,fill="#e6f2f3",border_color="#087f8c",border_width=2mm),offset=(18mm,32mm))oval = page.add(ellipse(size=(48mm,32mm),fill="#e6f2f3",border_color="#087f8c",border_width=2mm),offset=(88mm,32mm))box_dot = ellipse(size=(2mm,2mm),fill="#df6e70")path_dot = ellipse(size=(2mm,2mm),fill="#009e88")ink_dot = ellipse(size=(2mm,2mm),fill="#287dc3")for placed in [panel,oval] { page.add(rect(size=(placed.bounds.width,placed.bounds.height),border_color="#8396a1",border_width=0.15mm,border_dash=[1mm,1mm]),target=placed.bounds.top_left) page.add(box_dot,anchor=center,target=placed.bounds.top_left) page.add(path_dot,anchor=center,target=placed.path.nearest(to=placed.bounds.top_left)[0]) page.add(ink_dot,anchor=center,target=placed.ink.boundary.nearest(to=placed.bounds.top_left)[0])}shaft = page.add(line(end_head=head(), dx=108mm,dy=0mm,line_width=2mm,line_cap="round"),offset=(20mm,84mm))page.add(path_dot,anchor=center,target=shaft.path.start)page.add(path_dot,anchor=center,target=shaft.path.end)page.add(ink_dot,anchor=center,target=shaft.ink.boundary.nearest(to=(18mm,84mm))[0])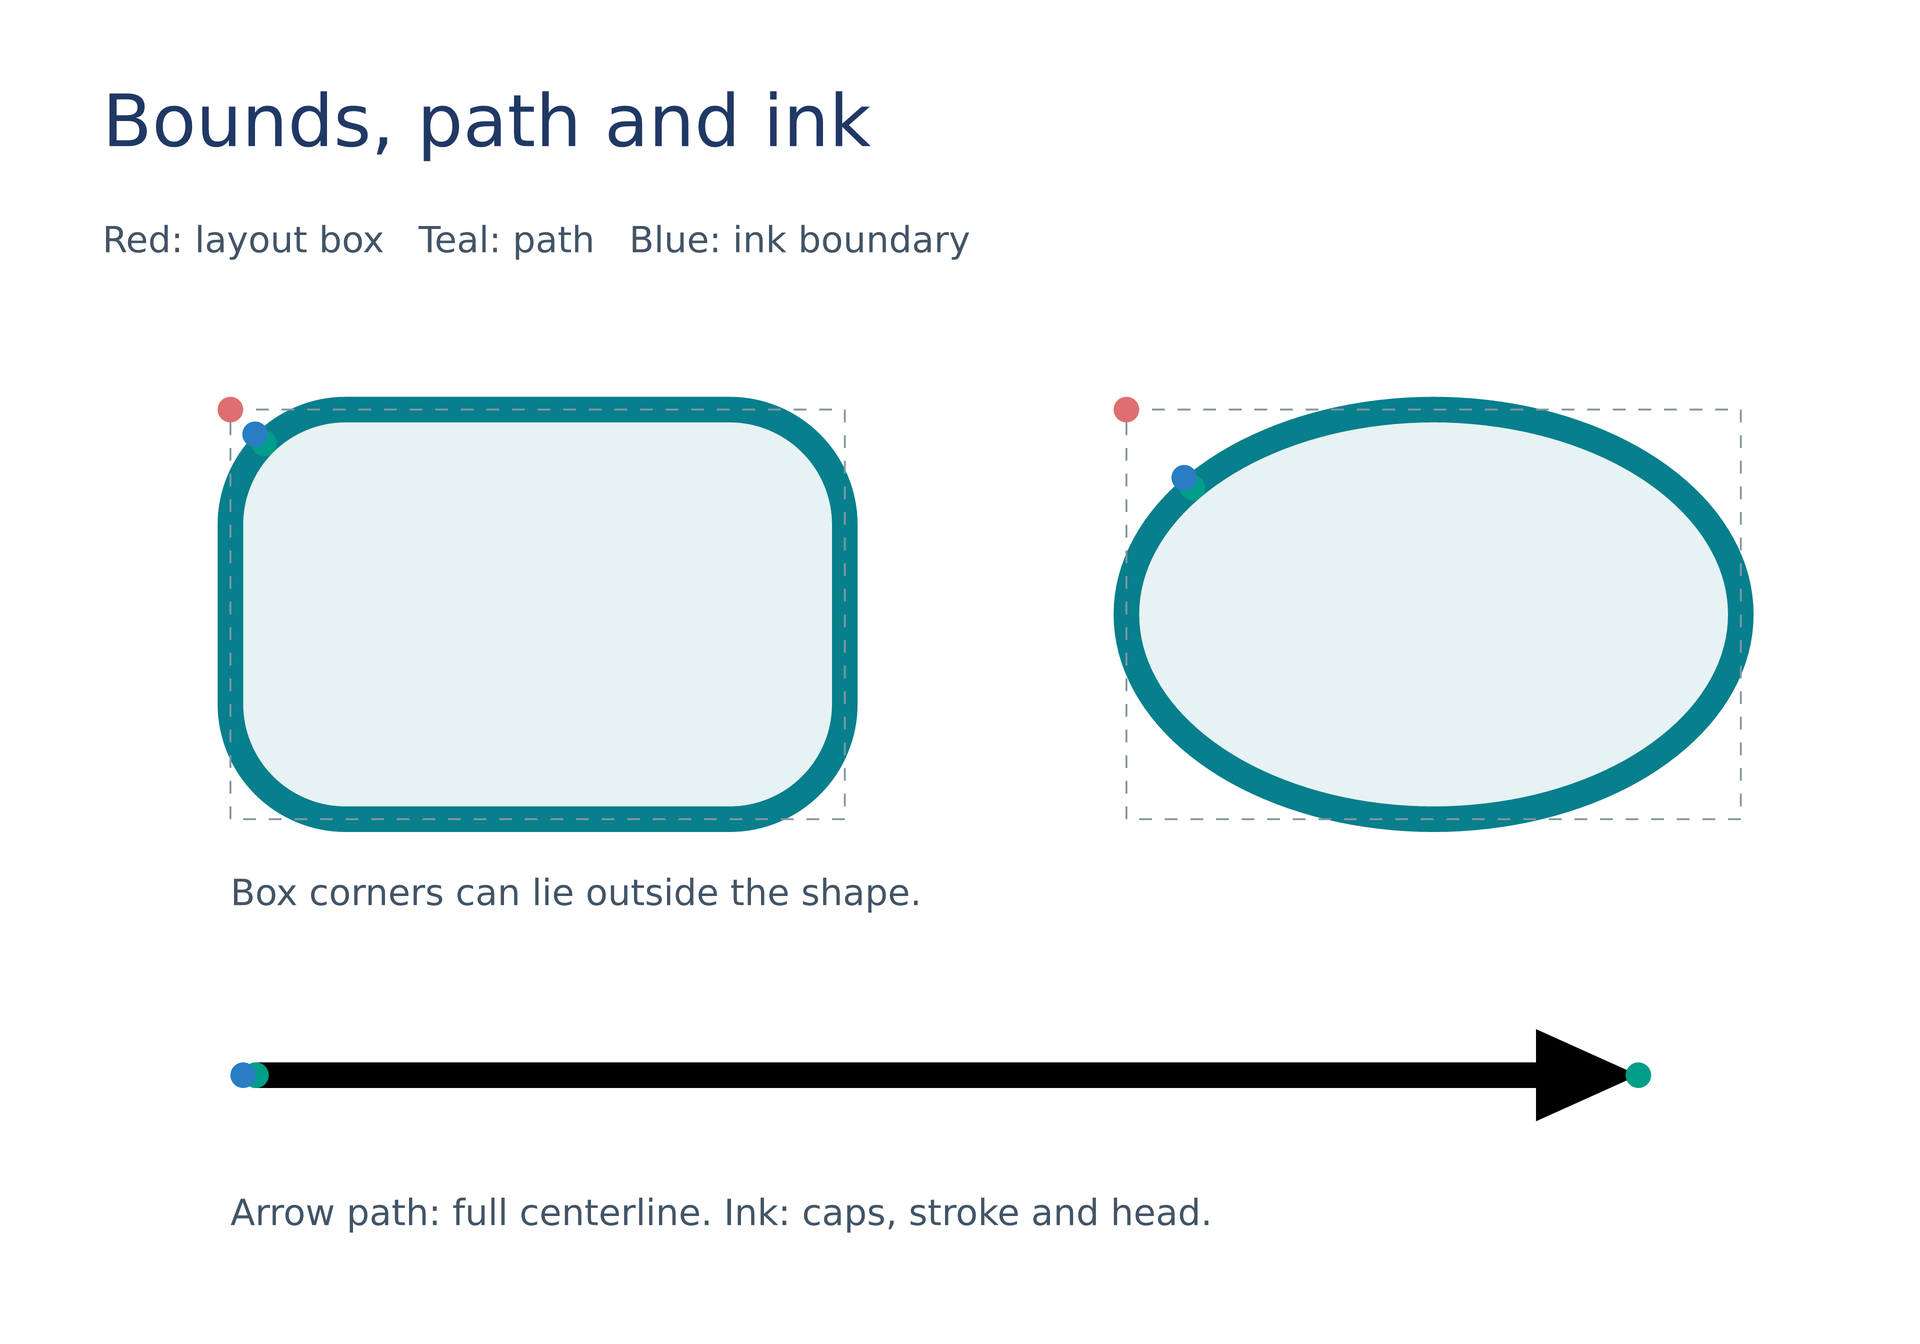
复现命令:laymesh validate examples/gallery/positioning/geometry-anchors.lay; laymesh render examples/gallery/positioning/geometry-anchors.lay -o geometry-anchors.png --dpi 150.
实测:有效:examples/gallery/positioning/geometry-anchors.lay(150 × 105 mm,18 个顶层实例); PNG 886 × 620 px, 150 DPI; 警告:无。
曲线路径定位#
原始节点与控制点、弧长和参数取点、区间查询与切线法线偏移。
curve=page.add(path(commands=[move_to(0mm,0mm),cubic_to(0mm,0mm,0mm,35mm,70mm,35mm),cubic_to(85mm,35mm,100mm,0mm,110mm,0mm),line_to(120mm,12mm)],border_color="#287dc3",border_width=0.6mm),offset=(15mm,36mm))route=curve.path.subpaths[0]node_dot=ellipse(size=(2mm,2mm),fill="#203864")for point in route.nodes {page.add(node_dot,anchor=center,target=point)}control=route.segments[0].controls[1]page.add(ellipse(size=(2mm,2mm),fill="#9caeb7"),anchor=center,target=control)halfway=route.at(fraction=0.5)parameter_half=route.segments[0].at(t=0.5)page.add(ellipse(size=(3mm,3mm),fill="#009e88"),anchor=center,target=halfway)page.add(ellipse(size=(3mm,3mm),fill="#e59b38"),anchor=center,target=parameter_half)page.add(text("half length",font_family="DejaVu Sans",font_size=8pt,color="#009e88"),anchor=self.bounds.bottom_left,target=halfway,offset=(0mm,5mm),offset_space="target",rotation=halfway.tangent_angle)page.add(line(dx=9mm,dy=0mm,line_color="#203864",line_width=0.4mm),anchor=self.path.start,target=route.end,rotation=route.end.tangent_angle)interval=route.between(route.nodes[1],route.nodes[3])page.add(node_dot,anchor=center,target=interval.at(fraction=0.5))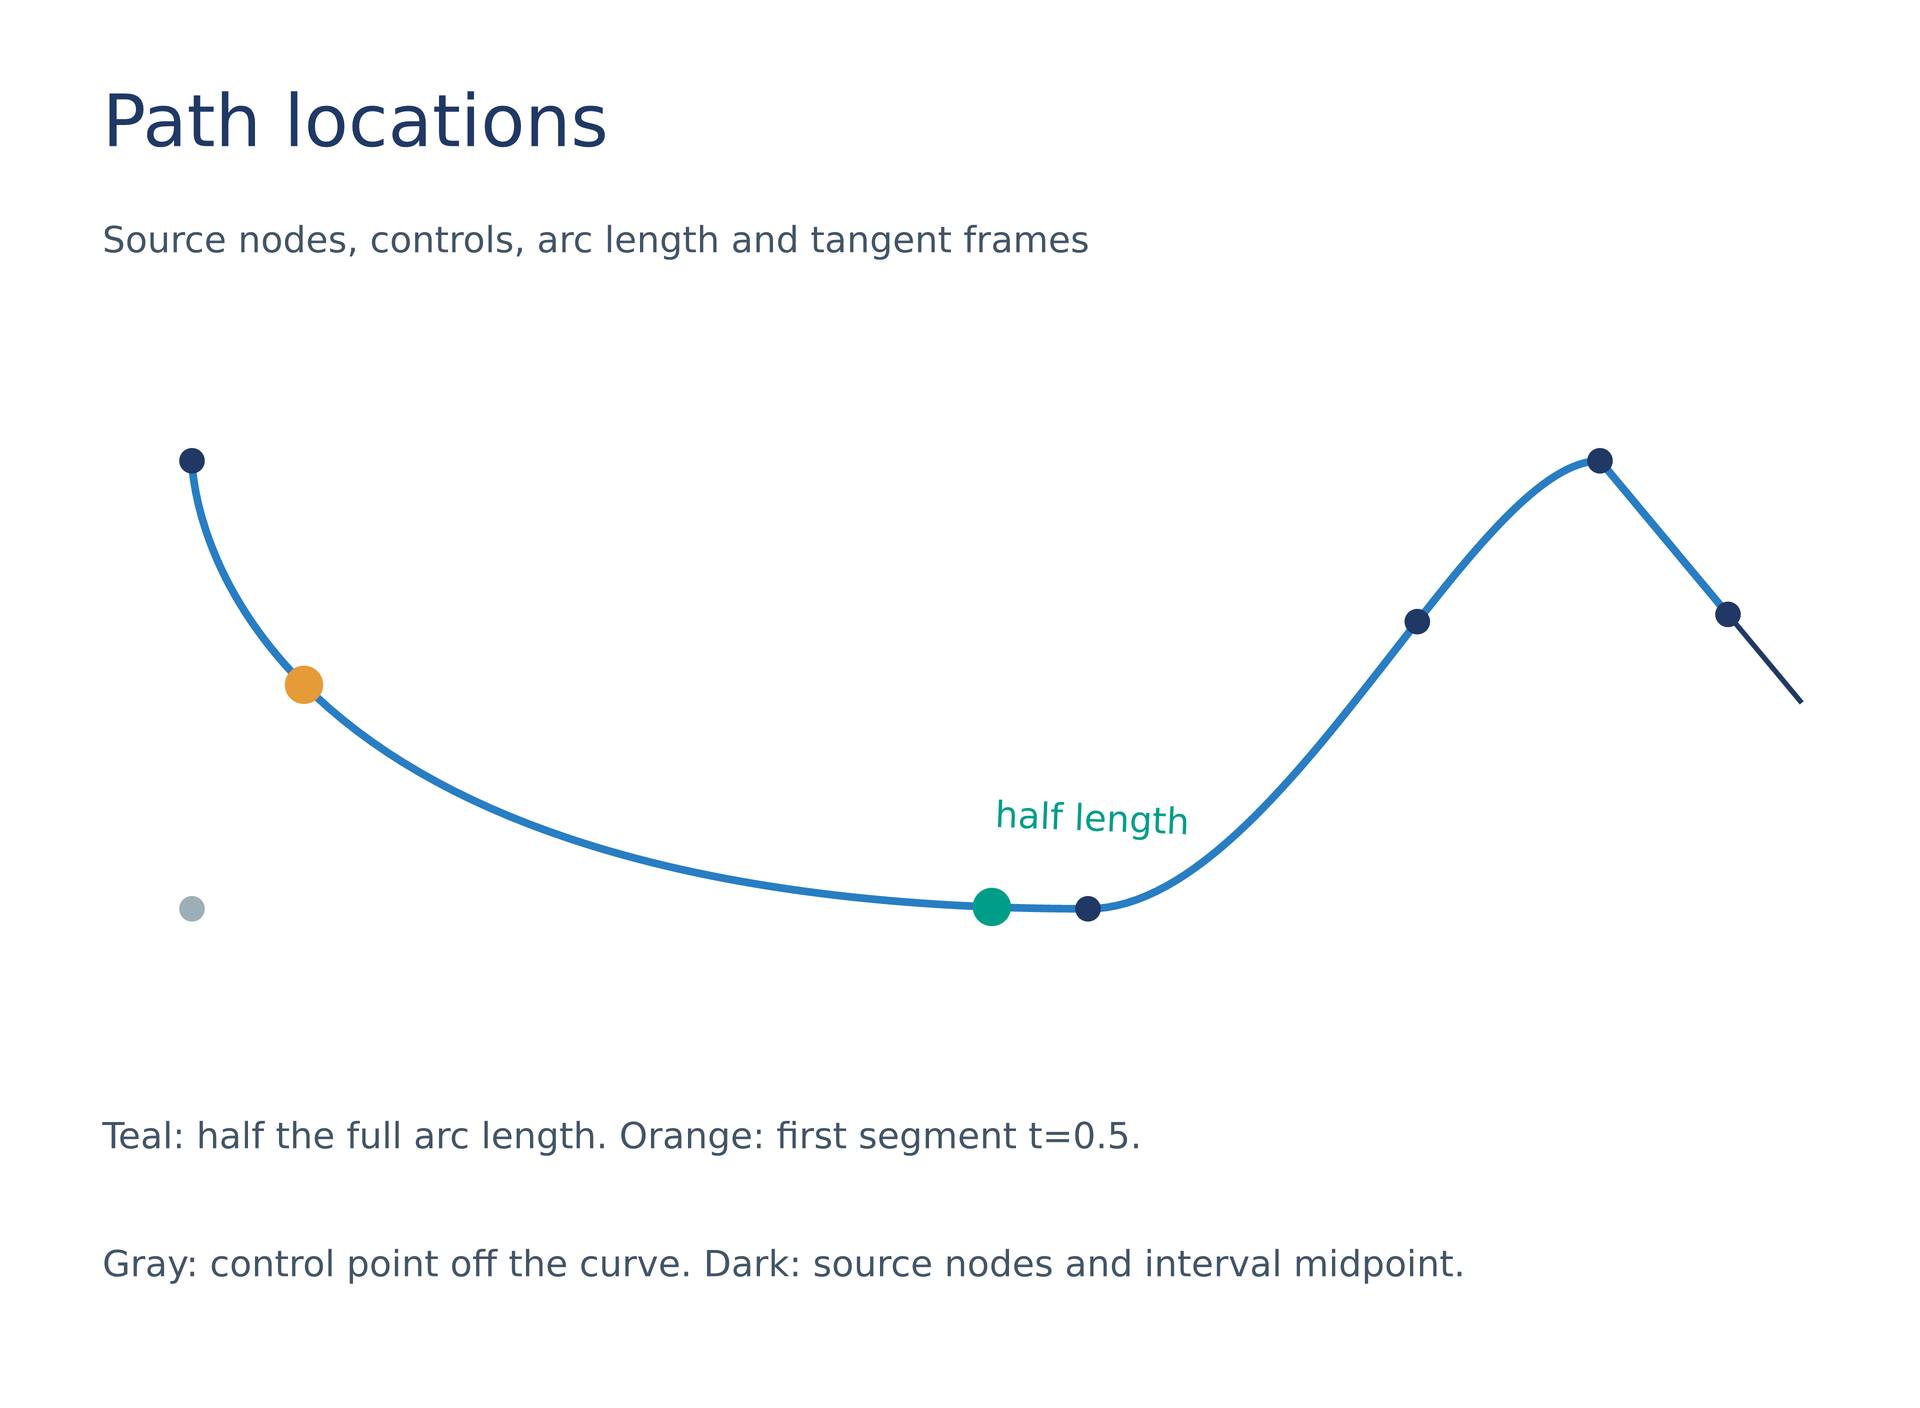
复现命令:laymesh validate examples/gallery/positioning/path-locations.lay; laymesh render examples/gallery/positioning/path-locations.lay -o path-locations.png --dpi 150.
实测:有效:examples/gallery/positioning/path-locations.lay(150 × 110 mm,15 个顶层实例); PNG 886 × 650 px, 150 DPI; 警告:无。
图表内部部件#
反向轴的数值端点、纵向轴线、标题布局框及数据坐标锚点。
p=plot(size=(136mm,88mm),plot_area=box(offset=(18mm,10mm),size=(98mm,58mm)),font_family="DejaVu Sans",x=axis(range=(0,4),reverse=true,label="Time (s)"),y=axis(range=(0,5)))p.add_axis(name="signal",side="right",axis=axis(range=(0,5),label="Signal"))p.line(y_axis="signal",x=[0,1,2,3,4],y=[1,2.2,1.8,3.5,4.2],marker="circle",color="#287dc3")chart=page.add(p,offset=(9mm,21mm))dot=ellipse(size=(2.4mm,2.4mm),fill="#df6e70")page.add(dot,anchor=center,target=chart.plot_area.bounds.top_left)page.add(dot,anchor=center,target=chart.axes["x"].min)page.add(dot,anchor=center,target=chart.axes["x"].max)page.add(ellipse(size=(2.4mm,2.4mm),fill="#009e88"),anchor=center,target=chart.axes["signal"].spine.path.at(fraction=0.5))label=chart.axes["x"].label.boundspage.add(rect(size=(label.width,label.height),border_color="#df6e70",border_width=0.2mm),target=label.top_left)page.add(line(dx=0mm,dy=-7mm,line_color="#df6e70",line_width=0.4mm),anchor=self.path.end,target=chart.data(x=2,y=1.8,y_axis="signal"))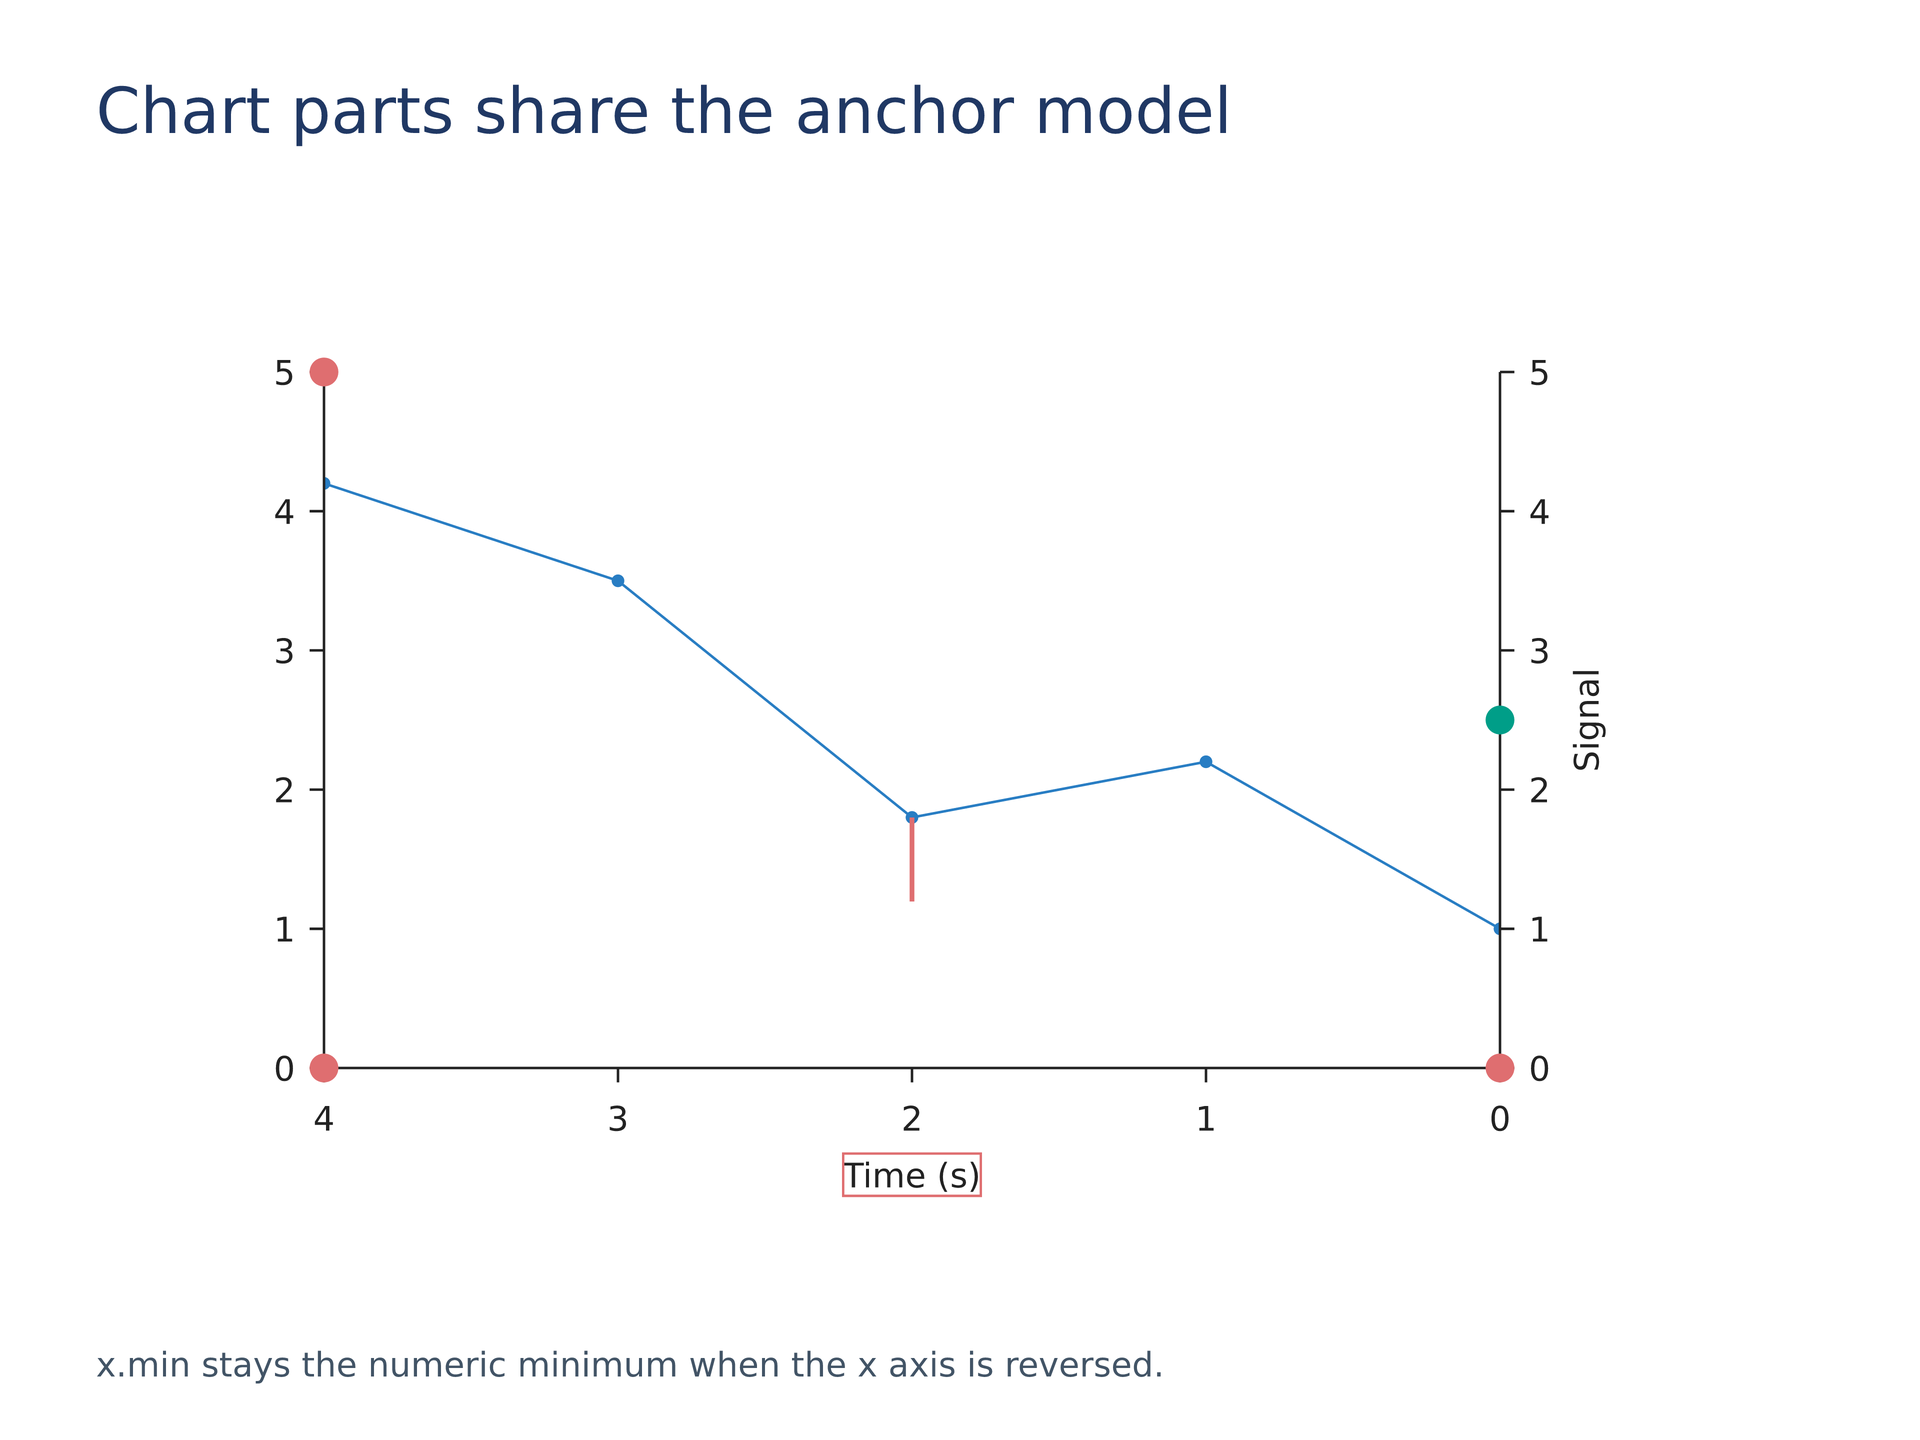
源码:chart-parts.lay。
复现命令:laymesh validate examples/gallery/positioning/chart-parts.lay; laymesh render examples/gallery/positioning/chart-parts.lay -o chart-parts.png --dpi 150.
实测:有效:examples/gallery/positioning/chart-parts.lay(160 × 120 mm,9 个顶层实例); PNG 945 × 709 px, 150 DPI; 警告:无。